Hi everyone!
I've been developing trading charts that display orderbook dynamics, i.e. how orderbook changes with time. They help seeing how tens of orders are being created, removed and moved from price level to another, all that real-time. Below you can see some screencasts of that in action.
Features.- See the orderbook activity represented visually.
- Watch bots activity, all HFT micro-events on a millisecond scale get charted.
- Analyse algo-trading patterns of other players on the market.
- Notice orderbook manipulation activity from bigger players.
- Real-time
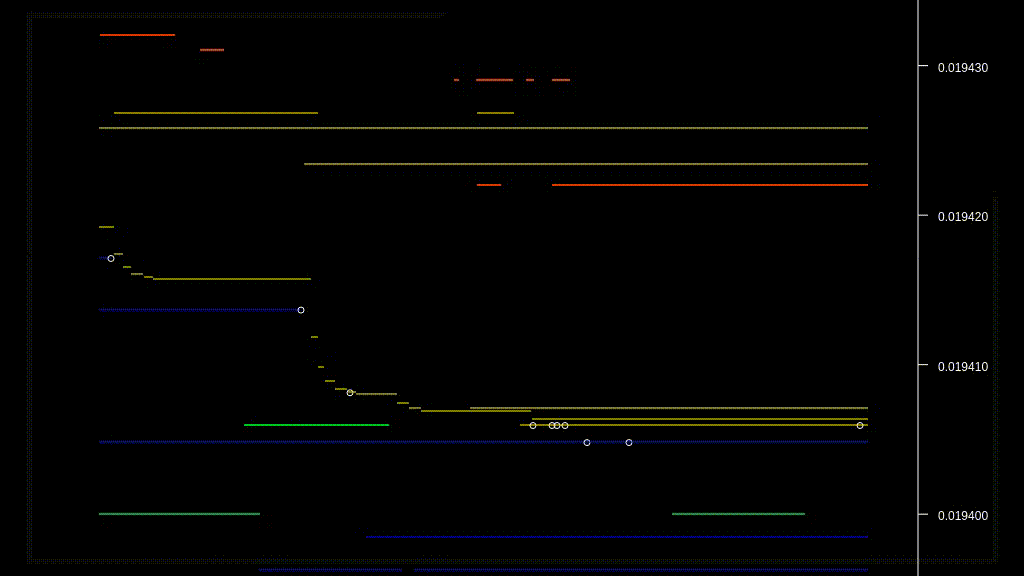
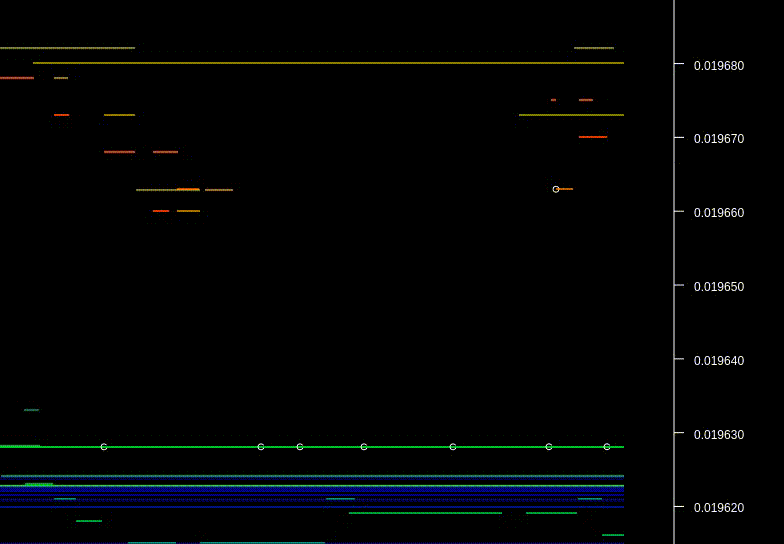
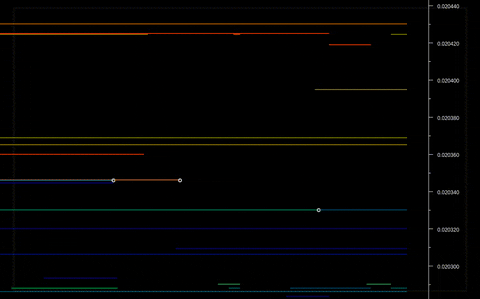
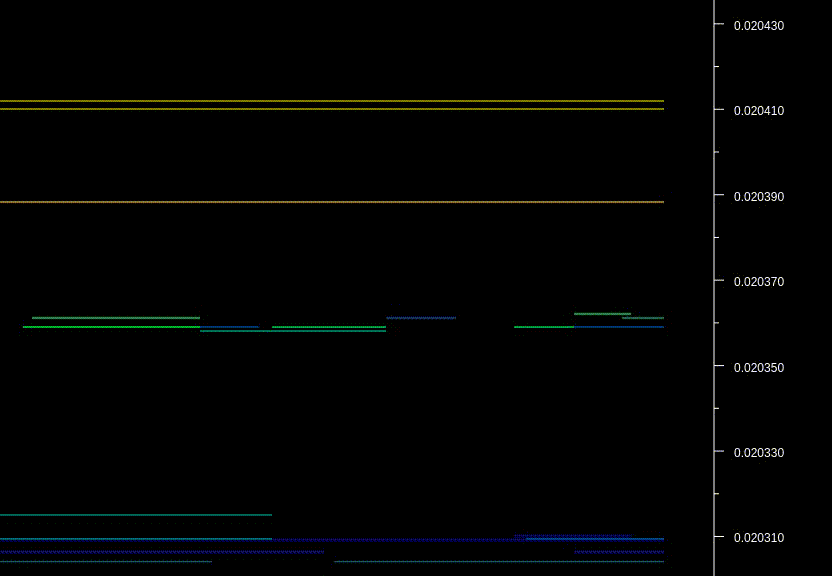
Examples.Every line on the chart represents an order in the orderbook. Lines are colorized according to the order size.
Yellow to
red lines are asks.
Yellow ones are small. The
redder the color, the bigger the ask size.
Blue to
green are bids.
Blue bids are small. The
greener the color, the bigger the bid size.
White circles are actual trades.
https://media.giphy.com/media/l3vR00ELKedHdVFeg/giphy.gifNotice bots moving their orders in funny patterns:
https://media.giphy.com/media/l3vRerNLKVThcF1e0/giphy.gifZooming in to a larger scale:
https://media.giphy.com/media/3o6ZtrBGky13QE4B9u/giphy.gifHFT activity, the bots are playing in the orderbook:
https://media.giphy.com/media/l3vQX97lr7kWIA5xe/giphy.gifContact meLet me know if anyone is interested in the charts.
I'm accepting investments to speed up the development and provide the charts as a product. PM if you're interested in investing.
Cheers!