Interesting analysis, always more than meets the eye. But, I would refrain from using the word "definitely" when speaking of anything political...
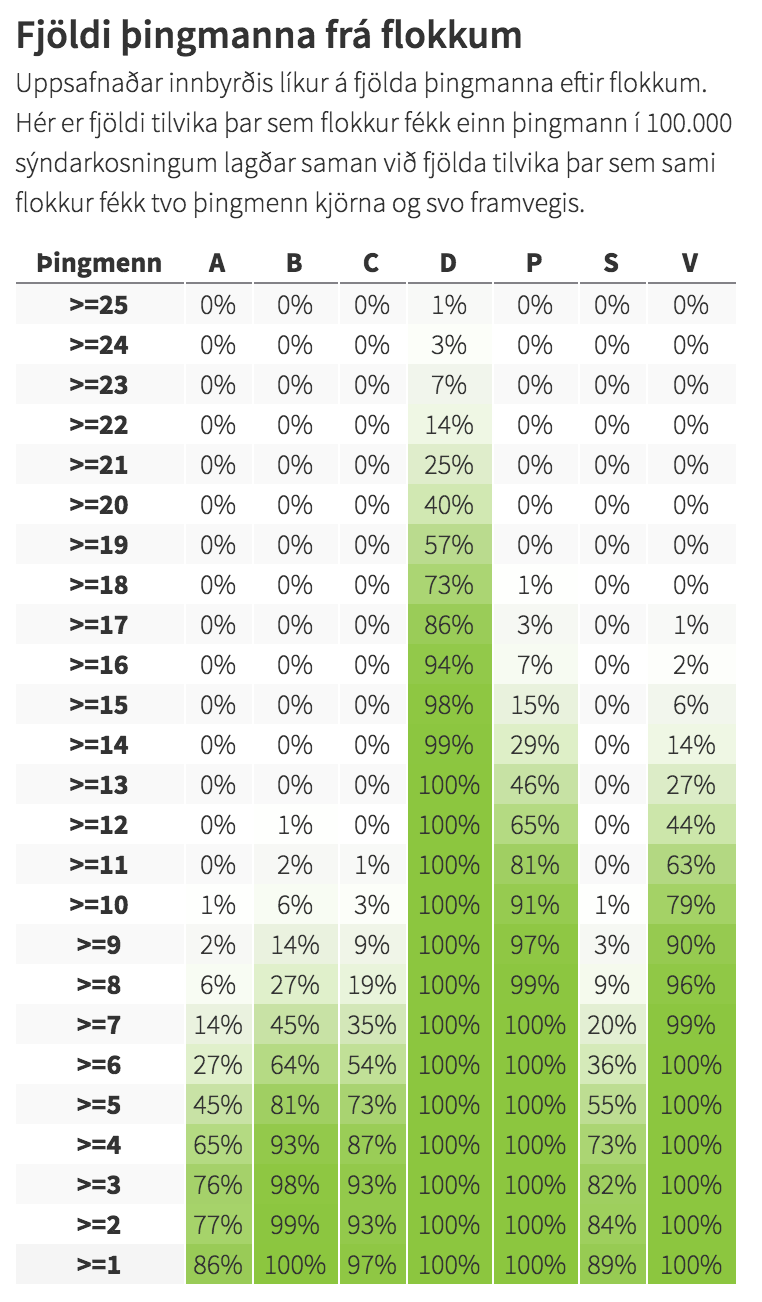
I stand by it in this case. The cumulative probability density plot for the number of MPs for individual parties can be found here:
http://kosningaspa.is/wp-content/uploads/2016/10/thingmannaspa28-7.pngThe statistical difference between the Pirates (P) and the Independence Party (D) is really quite exorbitant.
The Pirates remain the most likely to lead a government coalition, though.