Thanks !
One of the key to keep profit of midterm multi-day pump it's - sell partially (take profit partially) - because actually you can't know when pump is going dump
How can you know when you should sell your first part:
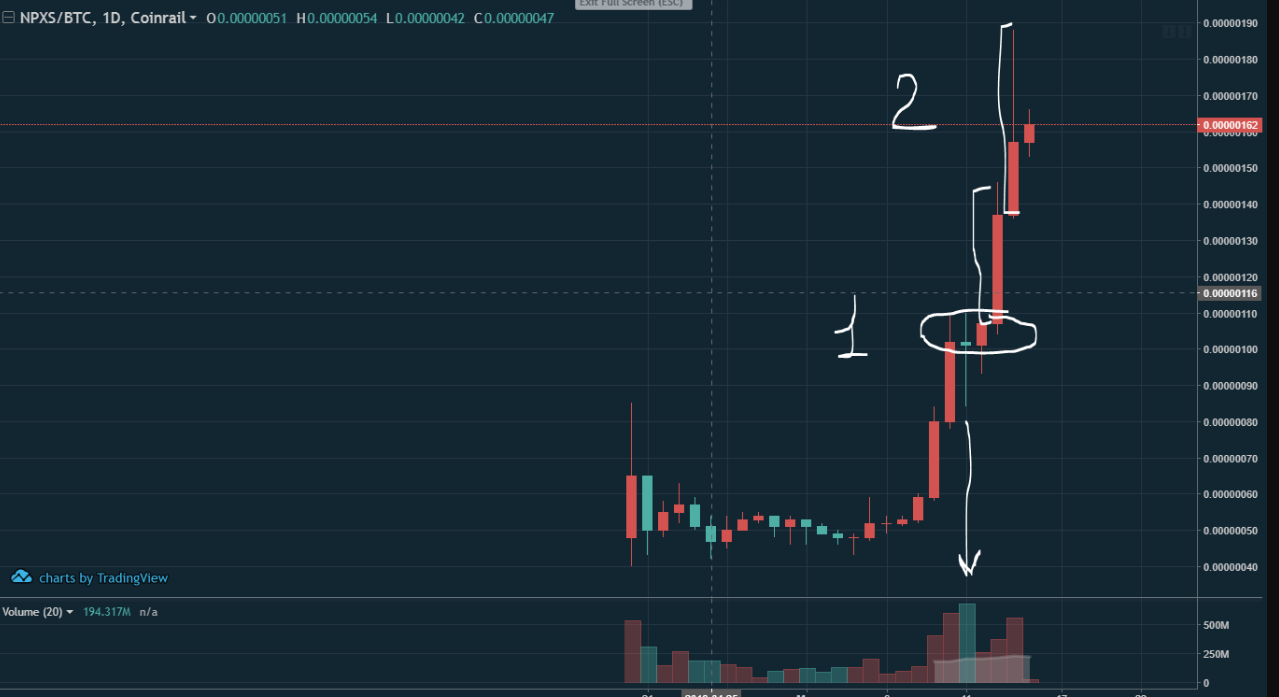
- After the first wave of pump, price usually making first stop, something like consolidation, around some "beautiful" prices like 0.00010, 0.000050, 0.0020, 0.000250 etc, or some strong levels. At this first price stop, you should sell part of your size (at least 40%).
- Then going second wave (in 60-70% it's a last wave), if there are huge 90 degrees candleson daily/less time frame chart w/ growing volume - it's the call to sell rest of your position (at least 80% of your amount you should sell). Also, there is a big dumping volume w/ a big dump candel that tell's that pump might be end here.
(if you see the exponential speeding chart it's always a call to get ready for dump )
- But there's a chance ( smole chance, but still exist), that pump not over yet,and for that case you have that 20% of your position, which can make you some extra profit or in any case you'll sell with profit.
You should keep on eye on the chart. Manage your position.
(That what we doing w/ multi-day pumps)
About NPXS:If we was in, on this levels we'd sell our 2nd part (at least 80% of full size)
Chart 1:
https://i.gyazo.com/21ecb2d82473d841696b2c7ae4244ac6.pngChart 2:
https://i.gyazo.com/62cb989df6e8e0f73393d0f29ddc3e00.png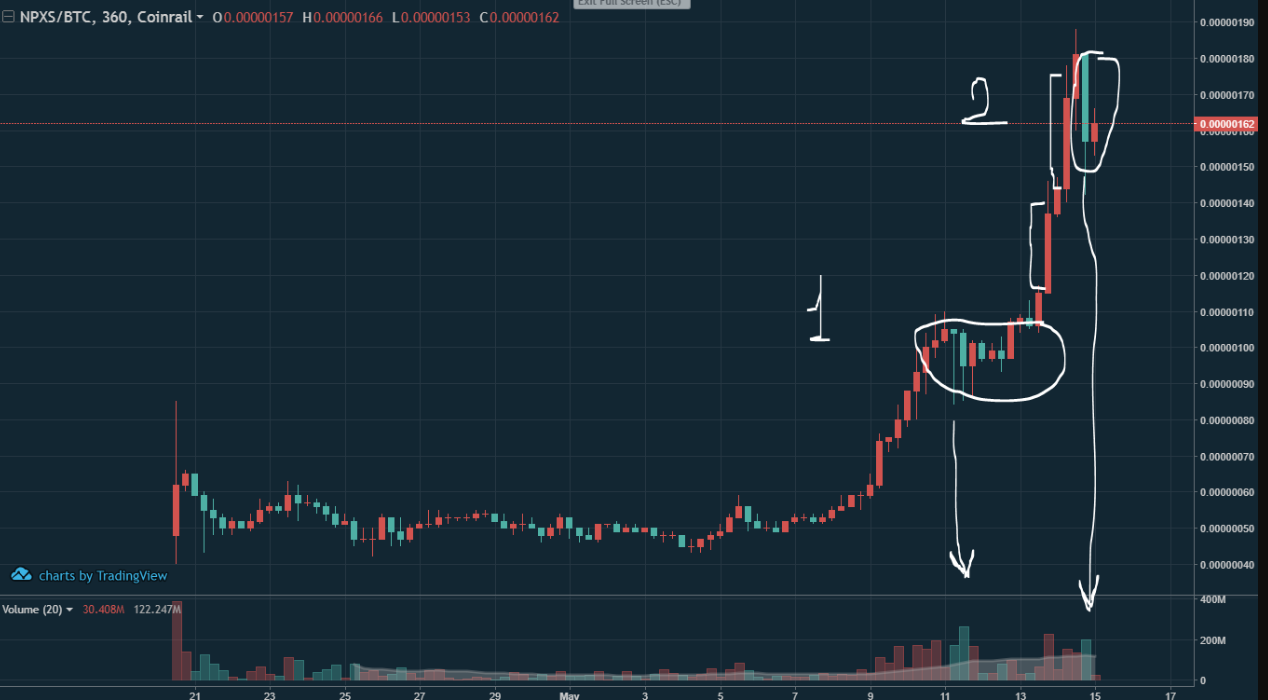