I did this back in
2015, but I wanted to update it. I used exactly the same mapping code as last time.
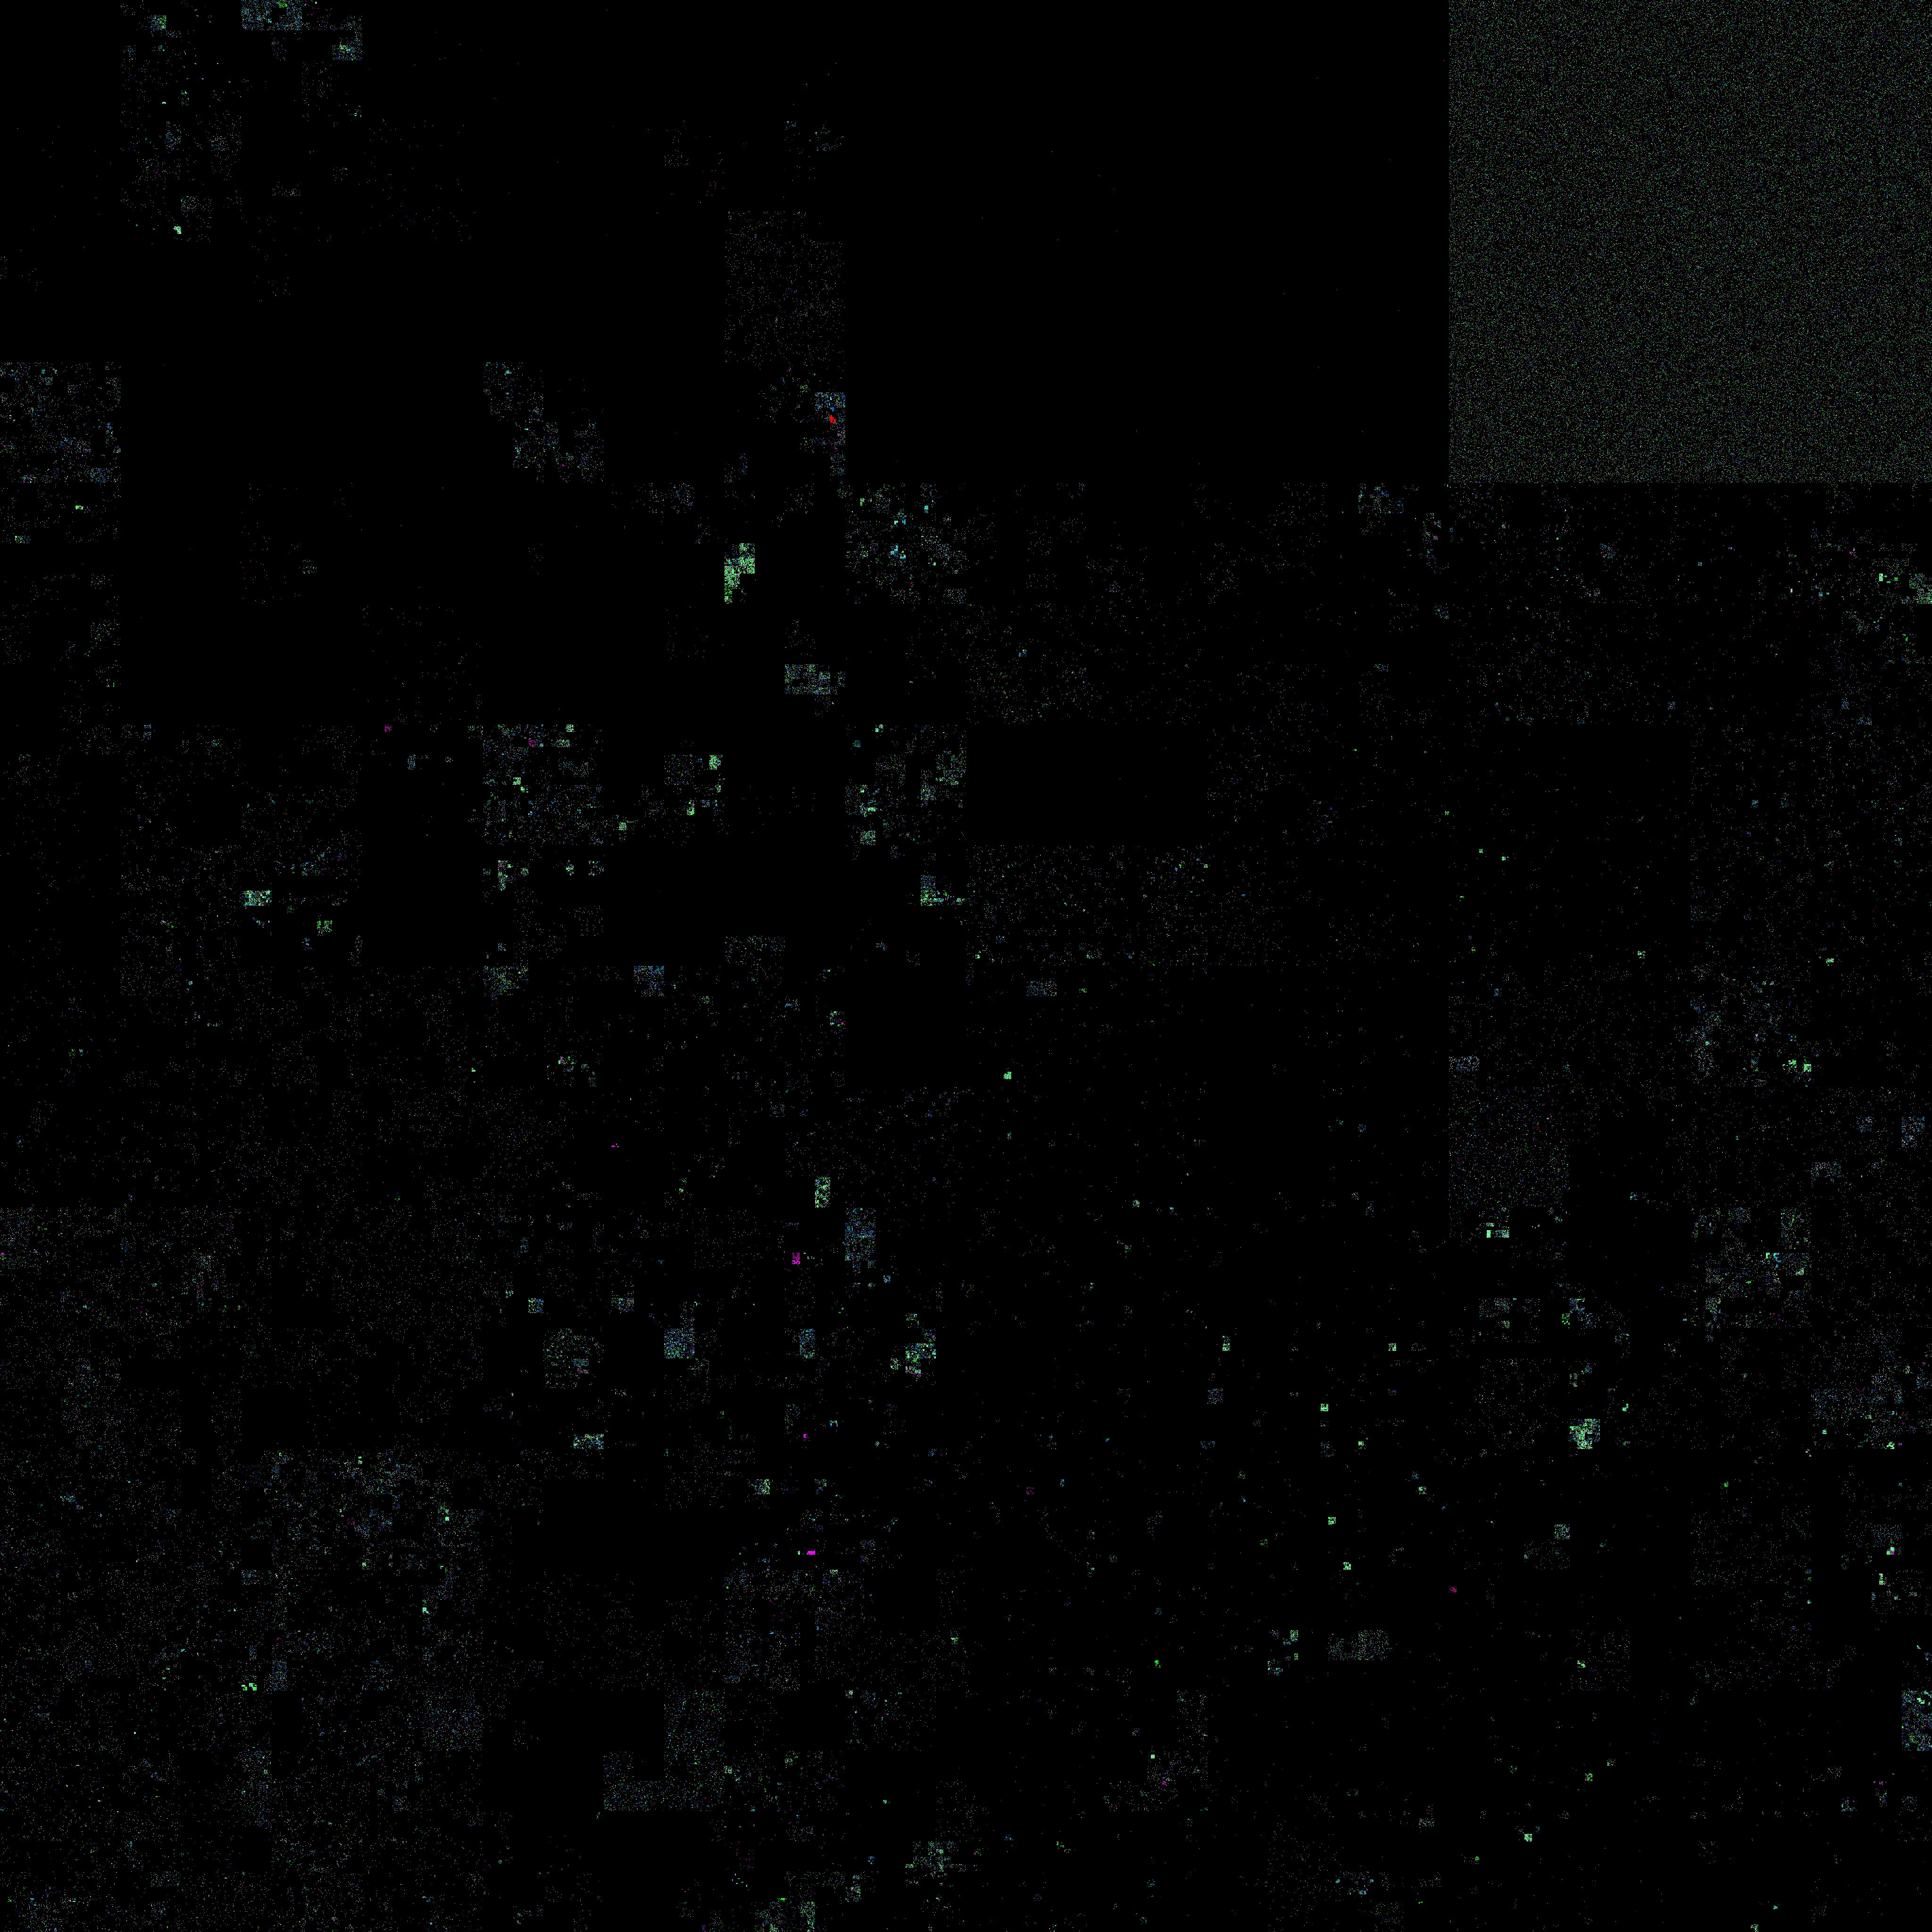
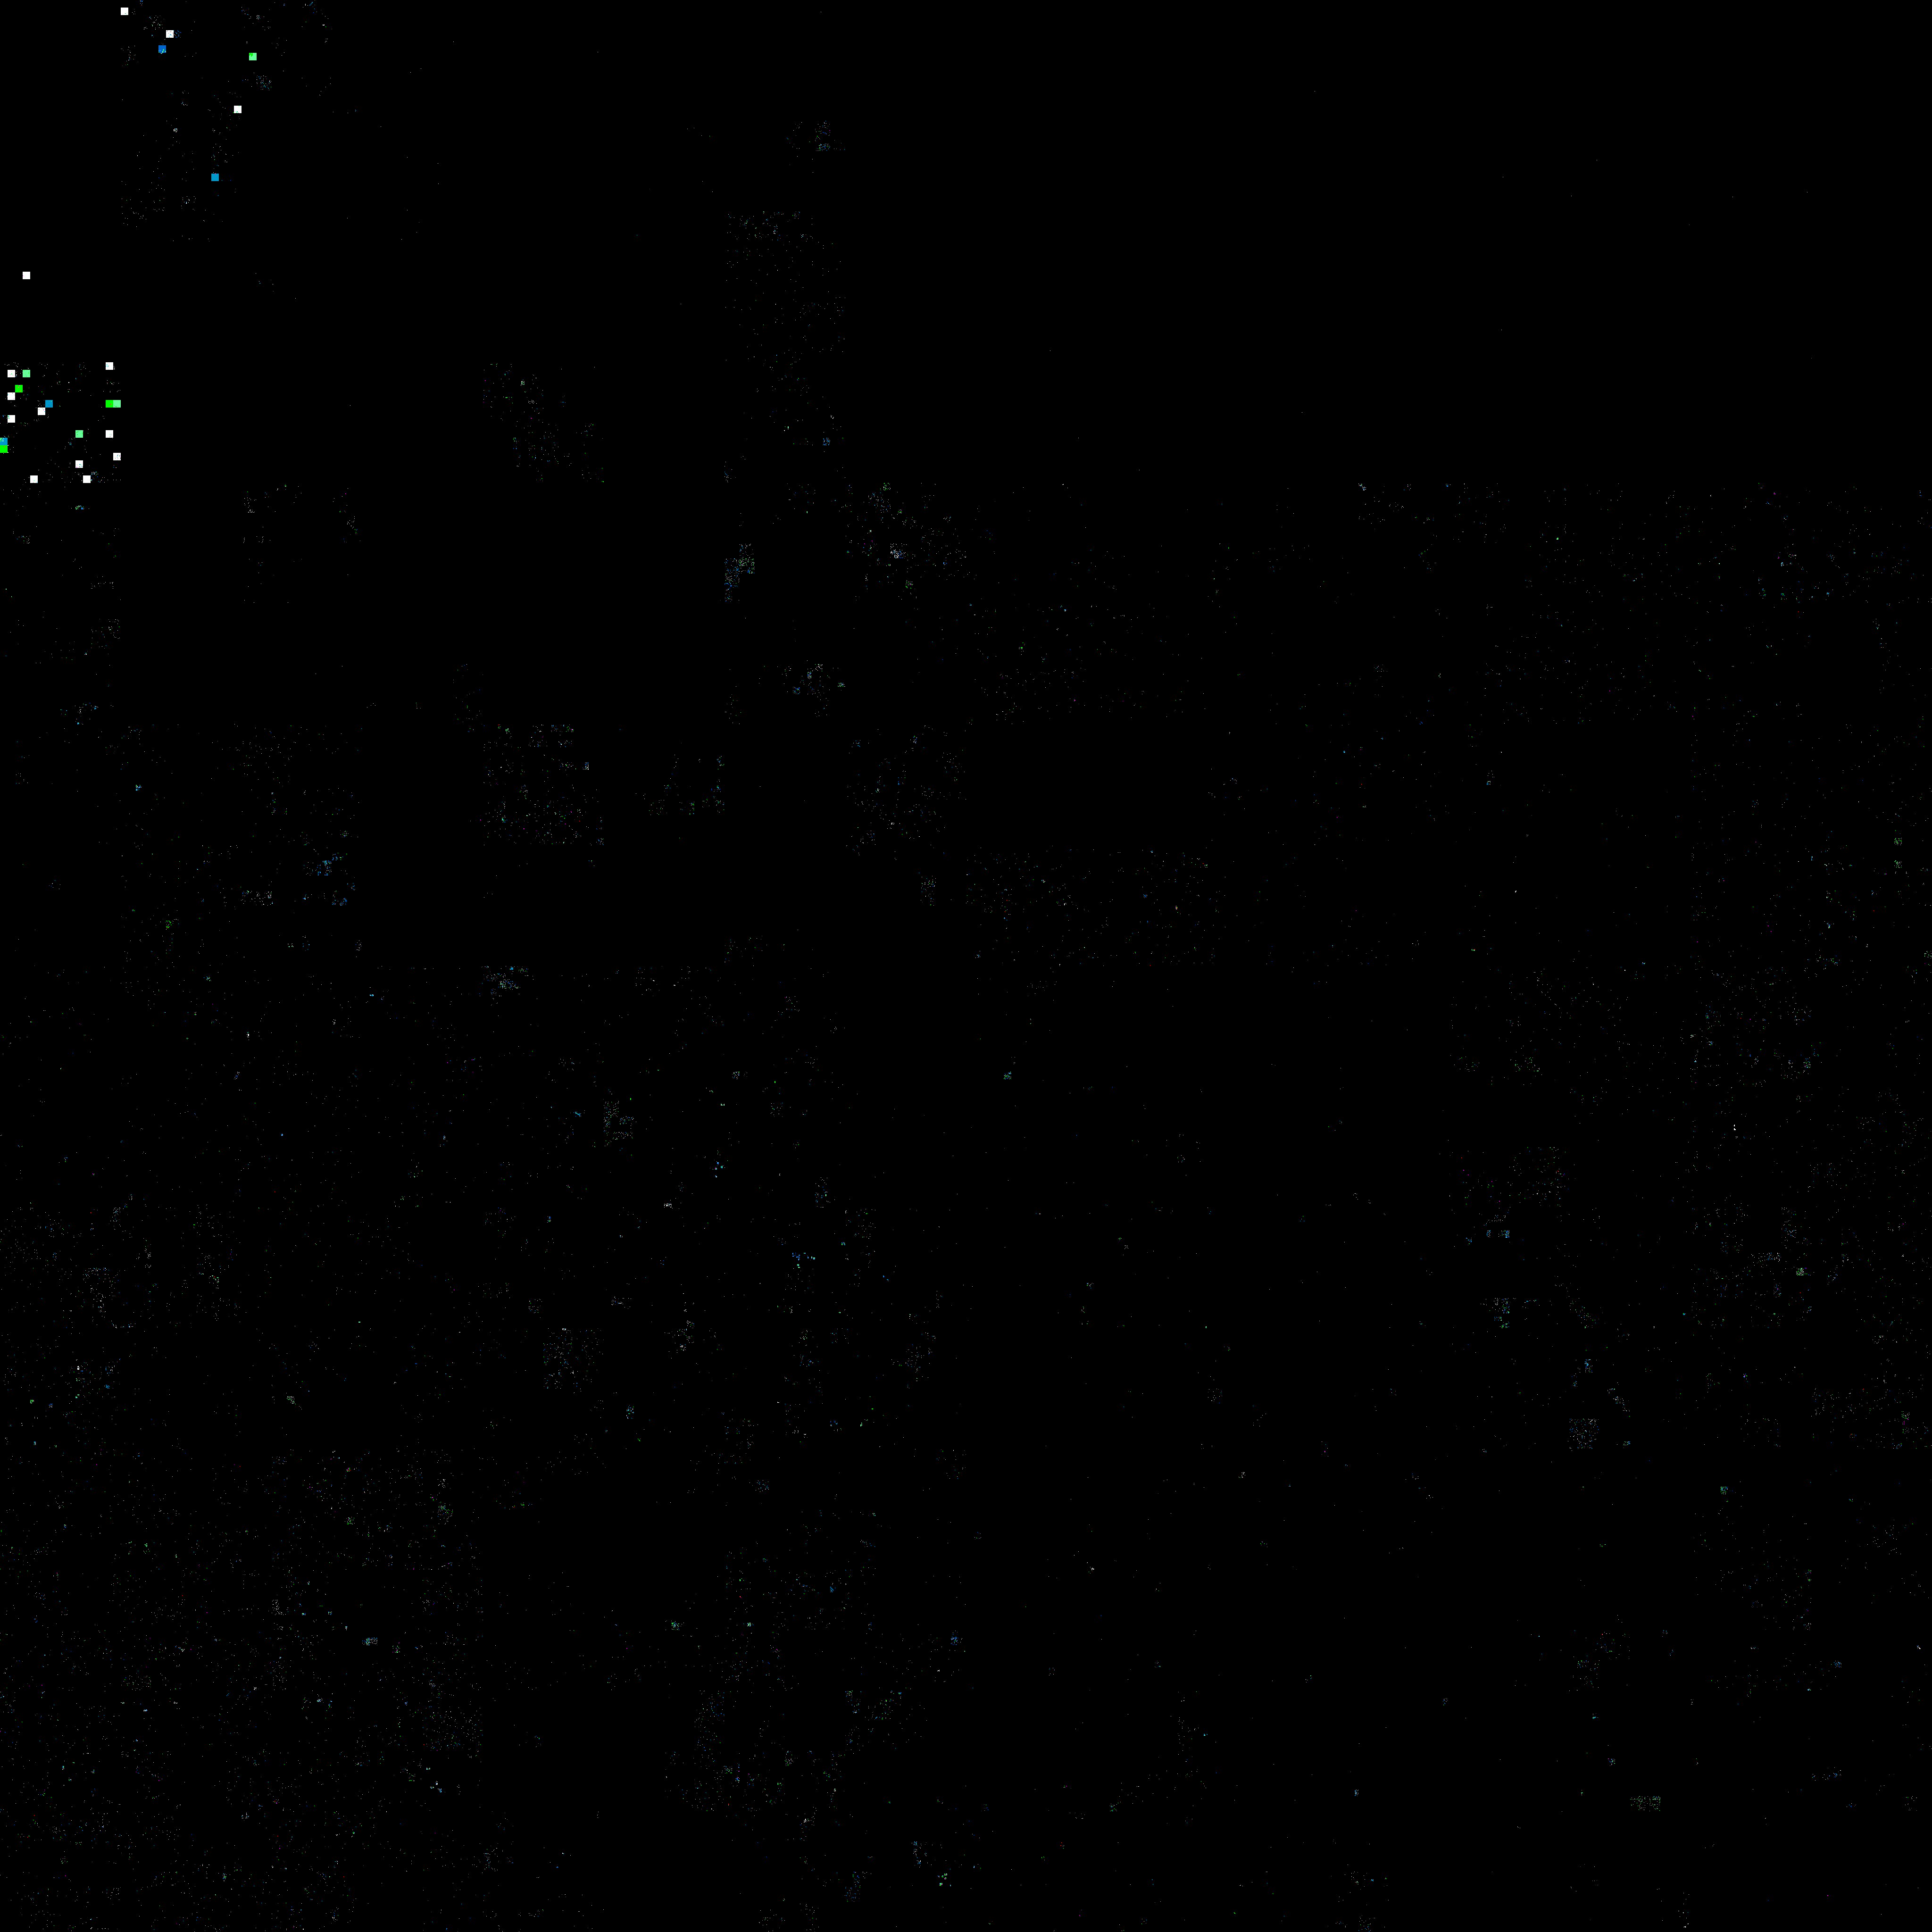
When someone is banned, their IP and some of their neighboring IPs receive evil points. Here I've created a map of the IPv4 Internet according to evil points. Currently, IPv6 is mapped into the 240.0.0/4 range, which is the large square taking up the top-right sixteenth of the chart. (I'm not sure yet whether IPv6 is actually disproportionately evil, or if I'm just cramming too many people into that address-space. Probably the latter is at least something of a factor, since 9% of traffic is IPv6 but 6% of this address-space is IPv6.)
Here's the image (zoom in):
https://bitcointalk.org/banmap201805.pngFor comparison, here's the one from 2015:
https://bitcointalk.org/banmap201510.pngEach pixel is a /24 address block (ie. each pixel represents 256 IP addresses). The colors are:
█ Zero or nearly zero evil
█ A small amount of evil
█ More
█ More
█ At this point you actually have to pay if you register an account in this block
█ More
█ More
█ More
█ Pretty high
█ A ton of evil, more than anyone is likely to pay
This is per block, so a single IP address could have an evil score requiring payment while its block still shows up as black here. A colored pixel indicates the evil score of a
typical IP in that block.
Addresses are laid out in the standard way. So you can for example cross-reference with these maps:
https://ant.isi.edu/address/A /24 should almost never uniquely identify someone, but to be safe I randomly added, removed, and modified some of this data for plausible deniability.