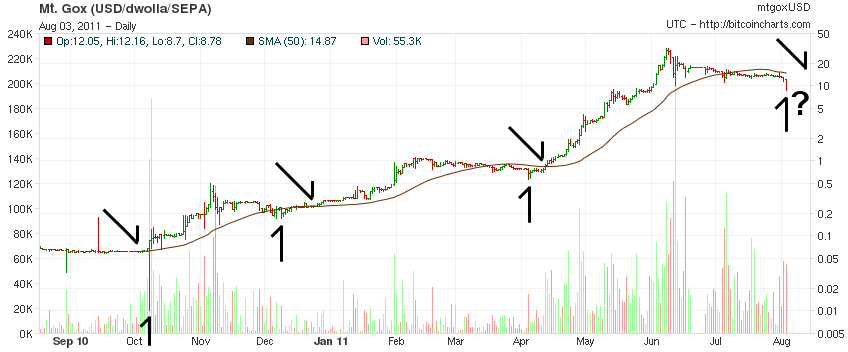
Notice that each breakout (diagonal arrows) was preceded by a sudden collapse in the price (vertical arrows) with the exception of the breakdown in October 2010 which occurred after the uptrend started.
Brown line is the 50-day moving average.
Not shown is one other horizontal consolidation and leg-up in May-July 2010. You can see that on the Bitcoin Market USD/PayPal chart.