What do you think of this?
I want to make a chart that shows a directional prediction of BTC/USD
left is value going to BTC and right is value going to USD
the chart is always pointing up because (to the moon psychology!)
the prediction will show forecast for the next few hours and new ticks will be over lade until the timer runs out
then a screen shot will be taken to show if the prediction was a correct forecast and it will go into a catalog of previous forecasts
and the next forecast starts and the process repeats.
the prediction will be made from center of gravity indicators measuring different levels while the forecast will calculate each levels curve
then the levels will all be added together and the forecast will be glued to the price at the time of the market forecast snapshot
while the forecast completes the timer will countdown and the new ticks will be appended on the chart in real time!
https://i.postimg.cc/9FpRcQCF/directional-forecast-chart.png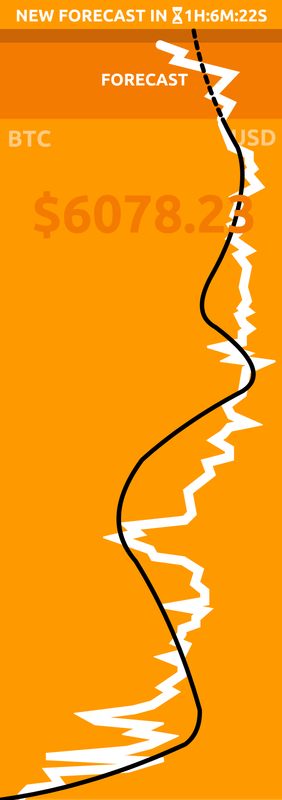