Alex, I appreciate you posting those manuals, alot more helpful than searching through countless blog posts (hopefully there are no special rules found only there).
I can't rule that out, but if yes, I suppose it would be fine tuning only.
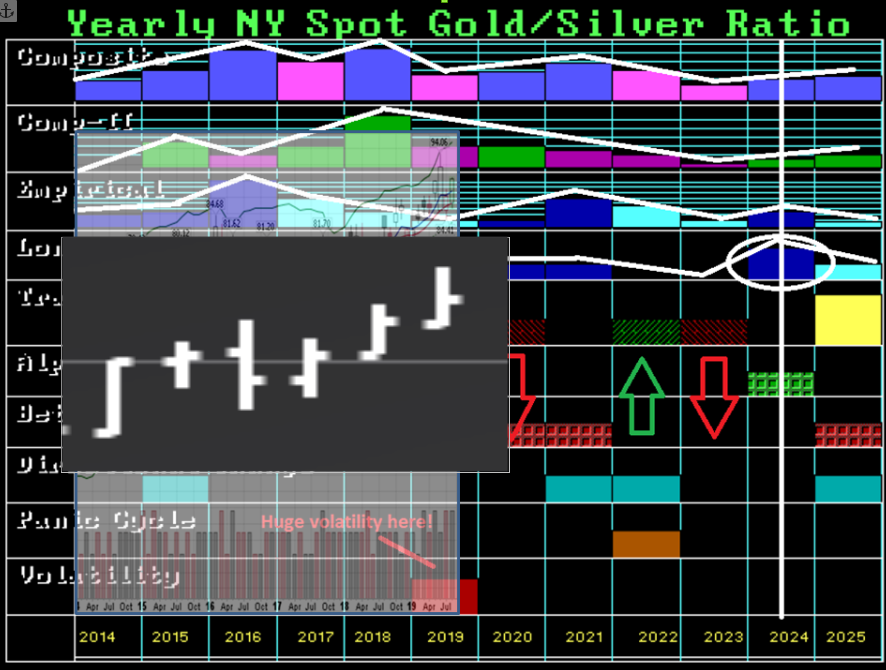
Sometimes I think that it is possible that arrays do not work equally good on all instruments. That doesn't make it any easier, but MA said this about reversals and I think this could also be the case with arrays. Although, MA never said that about arrays. It's just something that went through my mind when I saw this (kind of exotic) Gold/Silver ratio array. I've zero experience with the ratio, in general. I say exotic because I've not seen it very often in MA's blog posts.
I find this overlay chart kind of hard to read. Especially because the overlay is not yearly. I've added the yearly chart from Socrates as my own overlay. To me the first 3 bars look good. there is a turning point (high) in 2016. Then turning point in 2018 appears to be a cycle inversion since 2019 has made already higher highs.
https://i.postimg.cc/7YD7V72R/Auswahl-015.pngAt the same time I remember that there is a rule that says not only is the highest bar a potential turning point, but also the lowest. Since 2019 is also kind of the lowest bar for 3 years, I'm not sure if 2019 can also be considered a turning point and the ratio will decline again in 2020 into a 2021 low. I tend to believe that this is the more logical explanation and to me it looks like on your chart this is also what is penciled in. The alternative explanation would be that the cycle inversion continues (ratio rise) and 2021 or even into 2023 (lowest bar).
Another thought is that I would want to verify whether the chart has changed in the meantime since 2016. I guess it has not changed since higher time level arrays are generally more stable then daily's and weekly's, but who knows..
If you use the empirical or long term row to determine highs and lows, as far as I know you are on your own. Meaning I don't remember that MA has ever propagated this kind of usage of the array (as you also pointed out). I don't want to say that it doesn't work because I simply don't know. But I know that on the yearly level there are not enough samples to test that theory sufficiently. Even with the monthly array one would need a lot of time to build a good track record with a single market instrument. But monthly is still much better then yearly. Since the time levels are fractal (according to MA), the behavior of monthly and yearly should be at least similar if not the same.
In any case, I think there are rules that can be followed to determine turning points despite that there are occasionally unclear situations. Whether those rules work well all of the time and with all instruments is another, different question. I've seen arrays with turning points that worked well, but I'd also like to analyze more of them.