Relaying a message:
You mentioned in your video that some people think the BTC price will reach a new ATH before the coming May 14, 2020 halving. Im one of the proponents of the theory that the BTC price will reach a new ATH before the May 14, 2020 halving event.
A fundamental causation for my posited re-acceleration hypothesis is because I have analyzed the possibility that the legacy Bitcoin protocol is being readopted (analogous to the moonshot in the BTC price when legacy was first adopted in before 2013 and misdirection of adoption onto the impostor Core soft fork protocol) as warned by the powers-that-be. And I find evidence of this posited BTC price re-acceleration in the charts and also in the recent actions of some whales (c.f. also the Trilema.com/Dao attacker and what Bakkt did). All of the cryptocosm value will be refocused into the legacy Bitcoin with the coming poison pill game theory defense mechanism of the one proof-of-work chain to rule them all.
Below I will discuss some of the evidence of re-acceleration I find in the charts. Click the images to go to their source.
Readers may also be interested in my blog: McAfees Dick Math: illuminating Bitcoins ACCELERATING price
Lets start with your chart comparing the 4 year period prior to each of the 2 prior halving events and the upcoming Bitcoin halving event (3 cases total). Note the prior ATH of the current (i.e. top-most on your chart) case was nearer to the start of the four year period analogous to the prior (i.e. middle on your chart) case. Whereas, the final over the cliff drop to the bottom and the sudden and steep (i.e. more accelerated both in time and price) out that of that bottom for the current case is more similar to the first (i.e. bottom-most on your chart) case. Also notice for first (i.e. bottom-most) case that the rise in the price before the halving was not as great as for the prior (i.e. middle) case, but the rise after the halving was much more accelerated (both in time and price) for the first (i.e. bottom-most) case as compared to the prior (i.e. middle) case. Thus the BTC price rise after the halving for the current case should be more accelerated than the prior case:

Next lets refer to your chart comparing the level of the price at each subsequent halving event and the length of the reaccumulation (sic) phase before each halving event. Note that the prior (i.e. middle on this chart) case had both a higher price at and longer reaccumulation before its succeeding halving event than the first (i.e. left-most on this chart) case. Given an even longer reaccumulation before its succeeding halving event for current (i.e. right-most on this chart) case compared to the prior case, the BTC price should be even higher before and right at the coming May 14, 2020 halving as compared to the prior case:

Lets refer to the stock-to-flows (aka S/F) model below to see that the BTC price at the halving event in the prior case was 1.6 times higher than the S/F model price:

How much higher than the prior case should the price be at the coming May 14, 2020 halving event? Note in the charts below that the BTC price in your accumulation and expansion phases for the prior case were either below (at the same timing before the halving given by similar shade of green color) or at best only up to the S/F model price:


Whereas, the current case has already achieved 1.6 times higher than the S/F model price in this accumulation and expansion phase:

Thus we should expect the BTC price at the coming May 14, 2020 halving event to be accelerated 1.6 × 1.6 = 2.6 times the ~$8800 S/F model price at the coming halving event. Additionally the current case has even more reaccumulation time than the prior case to build an even higher BTC price at the coming May 14, 2020 halving event. Thus the price at the coming halving event could be 3 4 times $8800 or roughly $26 $35k. Additionally, Im positing double of (i.e. two times) those prices projections at the halving due to third-order derivative (i.e. the rate of increase in the acceleration) mathematical effects which I dont want to attempt to explain now.
Another reason the BTC price can front run the S/F model price rise at the halving is because PlanB recently unveiled the model.
Note I think the anonymous PlanB might be an agent (or an unwitting tool) of the bastard global elite who created Bitcoin are organizing the SegWit attack. PlanB (or someone at Twitter and Medium) banned and censored me from commenting on his Twitter and Medium blogs because I was getting too close to revealing these truths. I posit he has released this model to cause the market to front run the model and thus help achieve their goal of a nosebleed, moonshot BTC before the halving so that the hashrate difficulty will be so high when they initiate the SegWit donations attack that the Core protocol fork-off chain will become so slow that perhaps only a new block found every week or month. To drive the Core protocol fork-off to ~$0 price and complete their objective of surreptitiously concentrating most of the BTC in their own hands.
Also your projection for the ATH price after the coming halving is much, much too low. As I explained above, there is a reacceleration tweening between the prior and first cases. In those cases, the ATH price reached 3 and 10 times the S/F model price. Given the S/F model price will be $104k in 2021, the peak ATH should be at least $300k $1 million. And there is a front running acceleration, so that peak ATH price could be attained as early as the end of 2020 so that McAfee doesnt have to eat his dick. C.f. also my blog: McAfees Dick Math: illuminating Bitcoins ACCELERATING price
The current state of the RSI is indicating a sudden rise in the price is imminent analogous to 2013 (not 2017) for the reasons I explained above:
I thus expect the rise in the BTC price to mimic the entire year of 2013 from this point forward. A moonshot rise pre-halving, then a dip with the SegWit attack killing Core and focusing the cryptocosm on legacy Bitcoin, then legacy Bitcoin rising above $300k before the end of 2020.
Plausible reasons:
For the price objectives and timing over the next months until the Bitcoin halving event, I recently wrote in private email several days ago before the drop below $8600 and before LTC had dropped below $60:
My current scenario after studying carefully the fractal pattern correlation. The current U-shaped correction appears to be roughly 71% of the duration of the prior one earlier this year.
BTC should bottom on this current retracement below $8500 by Nov. 24. The ideal target is $8200. LTC will retrace to somewhere between $57 and $60.
On ~Nov 24, a spike up for LTC and BTC to ~$70 and ~$8700. Then a decline over next several days to $60 $64 and $8 $8.4k. Then another spike up on ~Dec. 5 to ~$75 and $9.7k. Then a decline over next couple of days to ~$65 and ~$8.5k. Then by ~Dec. 13 a spike up for LTC coupled with a slow rise for BTC to ~$80 and $8.7k. Then slow rise by ~Dec. 22 to ~$83 and $8.9k.
Thus I see LTC/BTC reaching only a maximum of 0.0093, although perhaps 0.0098 is possible on some intraday spike divergence for LTC and BTC. I would probably sell LTC at $80 and thus 0.0092 is likely the best I could achieve. Given an entry at 0.0069, that would be a 33% gain in BTC, if repurchasing BTC immediately after selling LTC. Those who entered at 0.006 might get a 50% gain in BTC if they time it perfectly.
Another strategy might be to sell maybe half at $75 and then if LTC drops to $65 repurchase for a 15% gain, else (if LTC does not drop) purchase BTC for ~$8.5k (because it seems BTC must drop otherwise it cant rise to $8.7k), so that is still a 27% gain in BTC is purchased LTC when LTC/BTC was 0.0069.
Frankly only a 33% potential gain (relative to BTC) is not all that incredibly enticing given the risk of the volatility of LTC. Timing may be end up elusive.
GRS-GRS-GRS-GRS-GRS-GRS-GRS-GRS-GRS-GRS-GRS-GRS-GRS-GRS-GRS
I did the same calculations for GRS and its about 3X leveraged in price compared to the prior fractal earlier this year. On ~Nov 24, GRS should rise to ~0.27 which if BTC is $8700, then GRS/BTC will be 0.000031. Then by ~Dec. 13 a spike up ~$0.48, and thus GRS/BTC 0.000055. So I think GRS/BTC has better leverage and can double your BTC, but you must have your sell limit orders waiting because the spikes can be completed in a couple of hours sometimes. A strategy would be to sell maybe half at $0.27 and attempt to reload at $0.23 or purchase BTC at $8700.
In this scenario, the rocket shot is timed perfectly with Armstrongs monumental ECM turn date, so ~Jan 1, 2020, a rocket shot to ~$116 and ~$12.5k. That will be the last chance to trade LTC for BTC. BTC may have an intraday (or next day) spike low of $11k. So if you sold at say $110 and repurchased $11.5k, that would be 0.096, thus increasing potential BTC gains to 40% (if purchased when LTC/BTC is 0.0069) or 65% if entered when LTC/BTC was 0.006. But thats going to be some chaotic timing. Hope the exchanges dont get slammed.
In this scenario, during the rest of January LTC will decline to ~$86 and BTC will oscillate but reach a peak of $13k. I wonder if we will get another flash crash in late January to $10k this time, mimicking the flash crash in April 2019.
In this timing scenario, before Feb 12 (2020), BTC will spike up again to $21k. Within a week a decline to perhaps ~$17.3k. Then another rocket shot to ~$32k by ~March 2.
The market would be somewhat confused at this point because the ATH would have been significantly exceeded well before the halving. Thus I would expect some sort of deeper and slightly longer correction. Maybe back to $21k again to throw many off the train who are looking to repurchase below the 2017 $20k ATH before the halving currently targeted for May 14:
https://www.bitcoinblockhalf.com/
That and including the uncertainty about whether the price will indeed go higher than ~$32k before any SegWit attack is why I will probably take all the cash I am going to need at $32k, then perhaps repurchase half of what I sold if the price drops to say $21k before the halving. Also I will be keeping my eye on the 111 DMA vs. twice the 350 DMA as mentioned in my prior email. Such an extended decline might be necessary to keep that 111 DMA from prematurely crossing down under twice the 350 DMA.
So then in April suddenly a moonshot to $50+k. Again my target is $78k but I will reaccess at that time after looking at all factors including where is the 350 DMA at that juncture.
Quote from: Shelby
Approximately every 4 years the reward that miners receive for finding a block, halves. This event is referred to as the Bitcoin halving and was hardcoded by Satoshi Nakamoto into the Bitcoin protocol to enforce its deflationary monetary policy.
[ ]
What will the Bitcoin price be at the halving?
[ ]
This video provides the exact price range to expect at the halving and looks at the possible height of the bull market following.
https://www.youtube.com/watch?v=UKHI_-SIcDU
[ ]
What will the Bitcoin price be at the halving?
[ ]
This video provides the exact price range to expect at the halving and looks at the possible height of the bull market following.
https://www.youtube.com/watch?v=UKHI_-SIcDU
You mentioned in your video that some people think the BTC price will reach a new ATH before the coming May 14, 2020 halving. Im one of the proponents of the theory that the BTC price will reach a new ATH before the May 14, 2020 halving event.
A fundamental causation for my posited re-acceleration hypothesis is because I have analyzed the possibility that the legacy Bitcoin protocol is being readopted (analogous to the moonshot in the BTC price when legacy was first adopted in before 2013 and misdirection of adoption onto the impostor Core soft fork protocol) as warned by the powers-that-be. And I find evidence of this posited BTC price re-acceleration in the charts and also in the recent actions of some whales (c.f. also the Trilema.com/Dao attacker and what Bakkt did). All of the cryptocosm value will be refocused into the legacy Bitcoin with the coming poison pill game theory defense mechanism of the one proof-of-work chain to rule them all.
Below I will discuss some of the evidence of re-acceleration I find in the charts. Click the images to go to their source.
Readers may also be interested in my blog: McAfees Dick Math: illuminating Bitcoins ACCELERATING price
Lets start with your chart comparing the 4 year period prior to each of the 2 prior halving events and the upcoming Bitcoin halving event (3 cases total). Note the prior ATH of the current (i.e. top-most on your chart) case was nearer to the start of the four year period analogous to the prior (i.e. middle on your chart) case. Whereas, the final over the cliff drop to the bottom and the sudden and steep (i.e. more accelerated both in time and price) out that of that bottom for the current case is more similar to the first (i.e. bottom-most on your chart) case. Also notice for first (i.e. bottom-most) case that the rise in the price before the halving was not as great as for the prior (i.e. middle) case, but the rise after the halving was much more accelerated (both in time and price) for the first (i.e. bottom-most) case as compared to the prior (i.e. middle) case. Thus the BTC price rise after the halving for the current case should be more accelerated than the prior case:
Next lets refer to your chart comparing the level of the price at each subsequent halving event and the length of the reaccumulation (sic) phase before each halving event. Note that the prior (i.e. middle on this chart) case had both a higher price at and longer reaccumulation before its succeeding halving event than the first (i.e. left-most on this chart) case. Given an even longer reaccumulation before its succeeding halving event for current (i.e. right-most on this chart) case compared to the prior case, the BTC price should be even higher before and right at the coming May 14, 2020 halving as compared to the prior case:
Lets refer to the stock-to-flows (aka S/F) model below to see that the BTC price at the halving event in the prior case was 1.6 times higher than the S/F model price:
How much higher than the prior case should the price be at the coming May 14, 2020 halving event? Note in the charts below that the BTC price in your accumulation and expansion phases for the prior case were either below (at the same timing before the halving given by similar shade of green color) or at best only up to the S/F model price:
Whereas, the current case has already achieved 1.6 times higher than the S/F model price in this accumulation and expansion phase:
Thus we should expect the BTC price at the coming May 14, 2020 halving event to be accelerated 1.6 × 1.6 = 2.6 times the ~$8800 S/F model price at the coming halving event. Additionally the current case has even more reaccumulation time than the prior case to build an even higher BTC price at the coming May 14, 2020 halving event. Thus the price at the coming halving event could be 3 4 times $8800 or roughly $26 $35k. Additionally, Im positing double of (i.e. two times) those prices projections at the halving due to third-order derivative (i.e. the rate of increase in the acceleration) mathematical effects which I dont want to attempt to explain now.
Another reason the BTC price can front run the S/F model price rise at the halving is because PlanB recently unveiled the model.
Note I think the anonymous PlanB might be an agent (or an unwitting tool) of the bastard global elite who created Bitcoin are organizing the SegWit attack. PlanB (or someone at Twitter and Medium) banned and censored me from commenting on his Twitter and Medium blogs because I was getting too close to revealing these truths. I posit he has released this model to cause the market to front run the model and thus help achieve their goal of a nosebleed, moonshot BTC before the halving so that the hashrate difficulty will be so high when they initiate the SegWit donations attack that the Core protocol fork-off chain will become so slow that perhaps only a new block found every week or month. To drive the Core protocol fork-off to ~$0 price and complete their objective of surreptitiously concentrating most of the BTC in their own hands.
Also your projection for the ATH price after the coming halving is much, much too low. As I explained above, there is a reacceleration tweening between the prior and first cases. In those cases, the ATH price reached 3 and 10 times the S/F model price. Given the S/F model price will be $104k in 2021, the peak ATH should be at least $300k $1 million. And there is a front running acceleration, so that peak ATH price could be attained as early as the end of 2020 so that McAfee doesnt have to eat his dick. C.f. also my blog: McAfees Dick Math: illuminating Bitcoins ACCELERATING price
The current state of the RSI is indicating a sudden rise in the price is imminent analogous to 2013 (not 2017) for the reasons I explained above:

I thus expect the rise in the BTC price to mimic the entire year of 2013 from this point forward. A moonshot rise pre-halving, then a dip with the SegWit attack killing Core and focusing the cryptocosm on legacy Bitcoin, then legacy Bitcoin rising above $300k before the end of 2020.
I really thought that once the price had moved into late 4 figures and 5 figures the percentages of the moves would be radically lower. People would be excited by a couple of hundred bucks. Yet it can still lose or gain 30-40% in a single day just as it could when it was 2 figures.
I don't know what that means, it doesn't seem healthy to me, but the possibility for truly barking moves is still more than alive and kicking.
If we think in terms of market cap and just how thin these markets are then it still doesn't really require huge sums to make giant moves. I expected it to be past that by now but it hasn't changed. It looks like it needs another monstrous move up before it does start to behave in a less shitcoiny manner and even then it might need another one.
Plausible reasons:
- Refer to my above readoption and thus reacceleration theory (which I know you think is loony and conspiratorial).
- The IRS ruled that spending any amount of digital virtual currency is a taxable event, thus hopeless for Bitcoin being adopted more as a currency.
- Bitcoin is being prepped as a 666 global reserve currency, to be used by $billionaires only. The coming SegWit attack will kickoff and destroy all the minions who think they own some cryptocurrency but will soon find out they do not.
- "The greatest shortcoming of the human race is our inability to understand the exponential function." (i.e. acceleration or second derivatives):
https://www.resilience.org/stories/2013-09-15/albert-bartlett-on-message-about-exponential-growth-to-the-end/
https://www.youtube.com/watch?v=sI1C9DyIi_8
With exponential growth, the lily pond can be 50% covered on the 29th day and on the morning of the 30th day, 100% covered with lilies.
Just because we cant see visually the fact that the price is about to soon obviously front run the halving, does not mean the front running isnt glaringly obvious mathematically. The front running is very well developed already. Most of you just cant see it so glaringly yet because your eyes are not visualizing math.
For the price objectives and timing over the next months until the Bitcoin halving event, I recently wrote in private email several days ago before the drop below $8600 and before LTC had dropped below $60:
Quote from: myself in email
Quote from: myself in email
IMPORTANT. MAKE SURE YOU READ THIS.
Strangely the fractal pattern at the current juncture for LTC/USD could be correlated to either early to mid Feb 2019 or Jan 10 2019. It appears LTC may be accelerating in time (but not in proportional price) compared to the prior fractal pattern earlier this year. So perhaps LTC will not decline below $60 again in 2019.
Whereas, BTC appears to not be accelerating in time but is accelerating in proportional price.
By proportional price, I mean compare the price rises from the prior $22 and $3102 bottoms as the difference in price from the bottom divided by the price drop from the cliff edge at $56 and $6550.
The calculation shows that LTC is 93% and BTC is 260% (2.6X) of the proportional price rises thus far compared to the prior fractal.
Thus I compute projected prices for LTC of $82, $116, and $158. And for BTC three consecutive monthly highs of $13k, $21k, and $32k.
But those prices do not have to occur at the same time, especially not the $82.
It seems the only way to fulfill the 0.01 LTC/BTC target is for LTC/USD to hit $82 while BTC/USD drops to $8200. Then the $116 can occur with a rocket shot in BTC to $13k. I was expecting that rocket shot at start of February, but everything may be accelerating in time.
Recently @infofront cited a Twitter post that said the LTC miners are preparing to disconnect their machines and pumping the LTC price so they can get out and liquidate their mining equipment (and LTC) at the best prices. Apparently they expect BTC dominance to return soon and they want to cash out.
BTC/USD may decline to $8200 before end of November with LTC rising to $82 as the very short altcoin season bleeds BTC for a month only. Then BTC slowly rising to $9600 before end of 2019. Then a rocket shot to $13k on Armstrongs ECM turn date in the start of January. With LTC rising to $116. Then $158 and $21k in February. In March BTC hits $32k and LTC and all altcoins are declining. In April BTC goes supernova to $50+k. My target for a spike high was $78k.
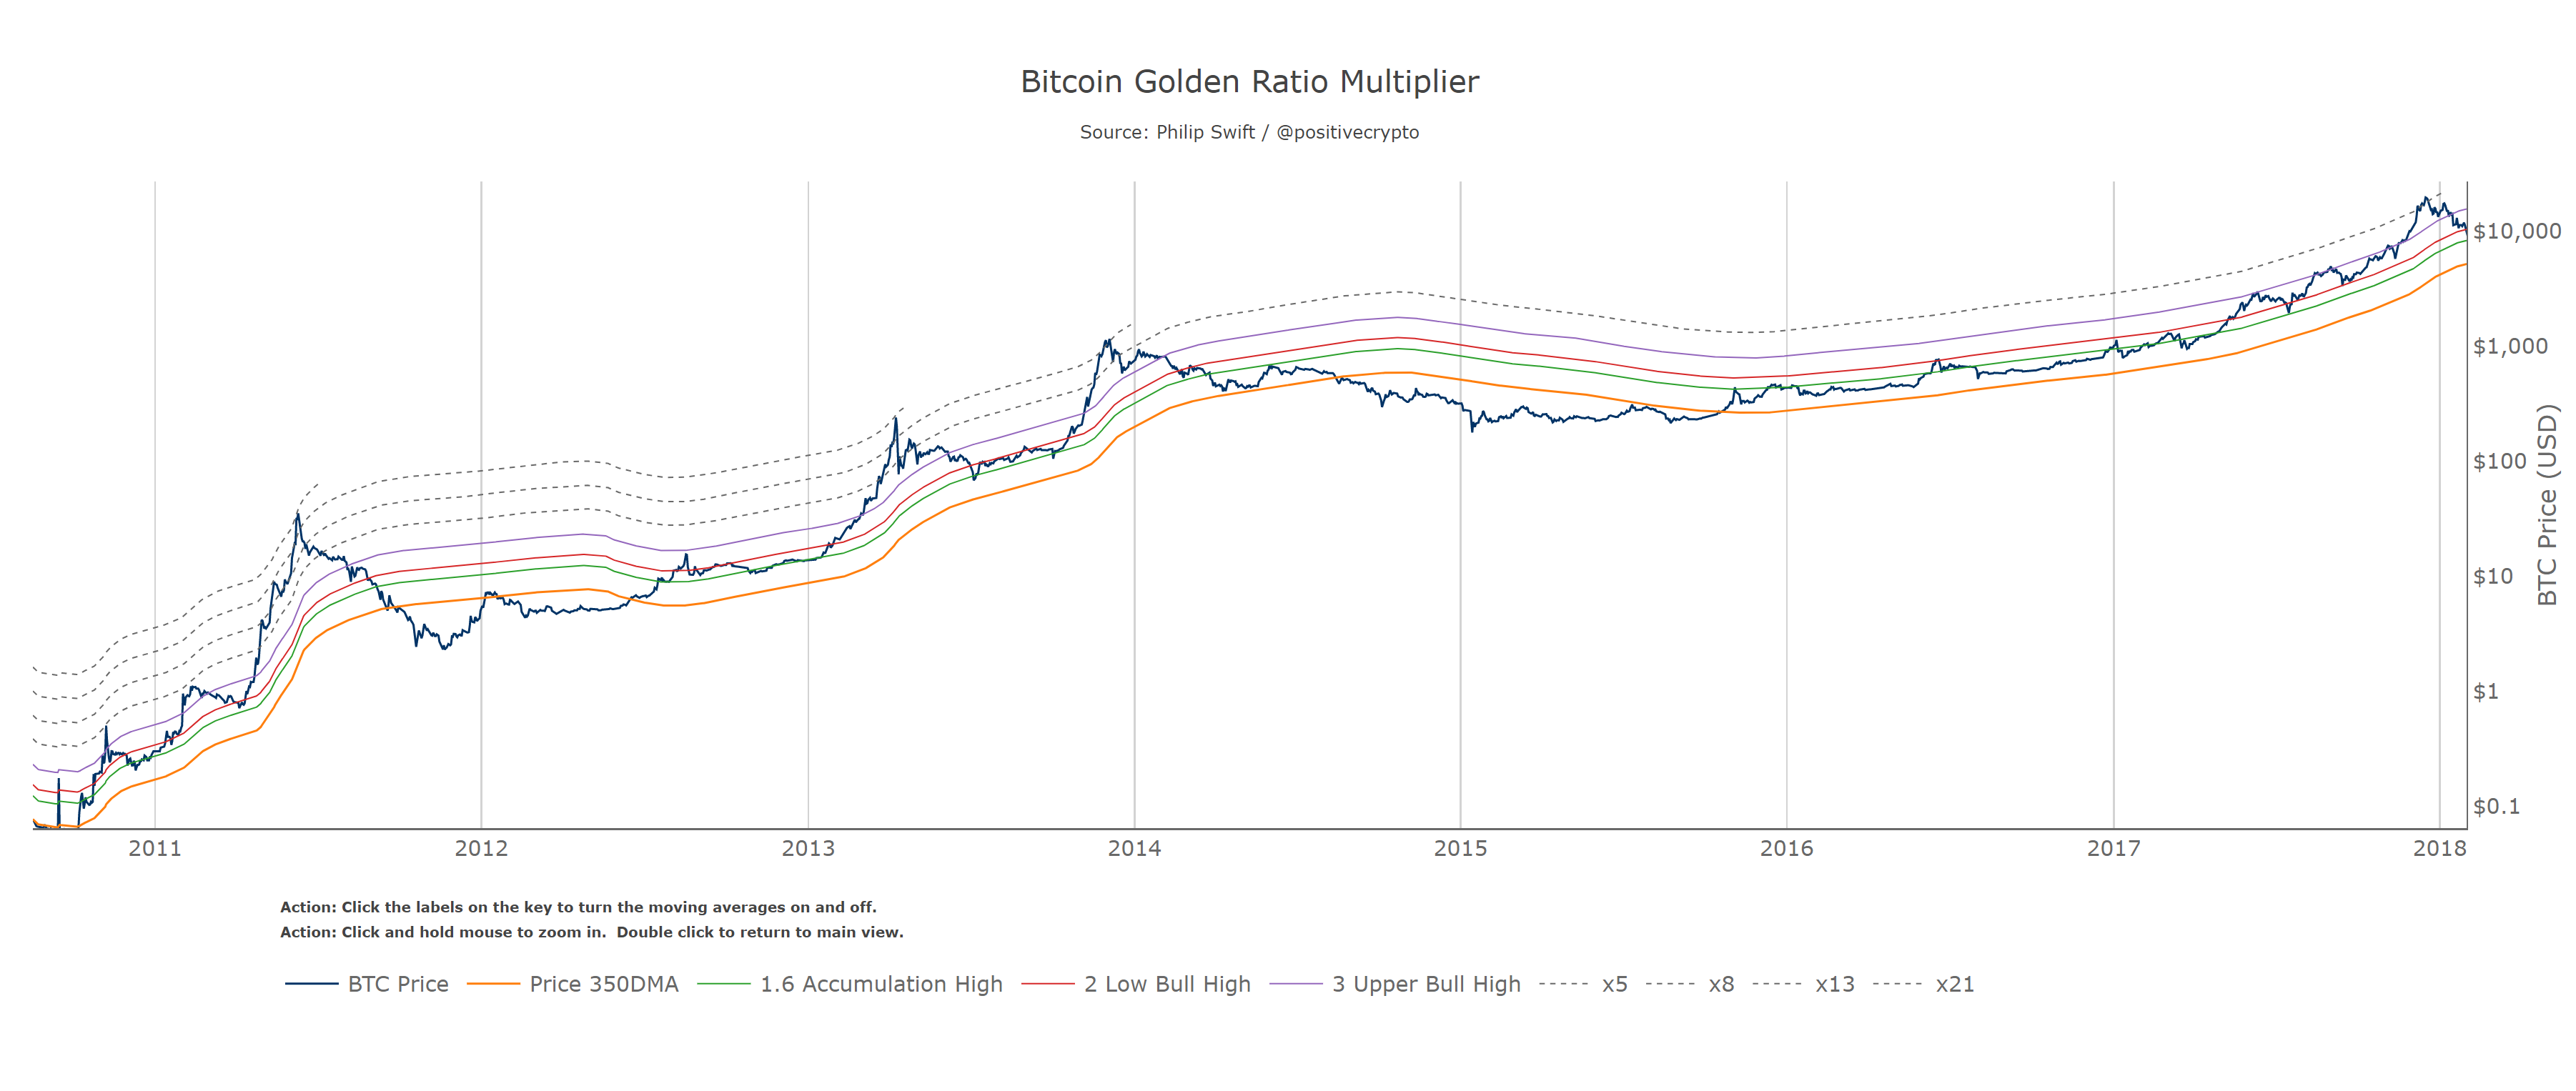
Lets revisit what may end up being a very, very important blog, perhaps even more important than Plan Bs stock-to-flows model:
https://medium.com/@positivecrypto/the-golden-ratio-multiplier-c2567401e12a
Focus on this chart:

Interestingly at the recent $13.8k high, the ratio to the 350 DMA was 2.4. That places it between the red and purple lines. Which thus corresponds to a tweening between the peaks in Q3 2012 and Q3 2013. Whereas the corresponding peak in 2015 commensurately before the halving was only up to the green line, so current fractal pattern is not corresponding to the 5 multiplier. And if we do get a rocket shot into the May (actually late April) 2020 halving, then the chart is going to look very fractally similar to the 2013 rocket shot.
So this means (as I had posited previously) that the multiplier for the coming peak in late April 2020 should be between 8 and 13. The 350 DMA is currently $7k and will rise to greater than $10k. Even if the multiplier does decline to 3 as that blog posits, that is still going to be in excess of $30k for the peak. So perhaps my $32k will be the peak and perhaps the rocket shot to $13k will not begin until February 2020.
However, I assert that the legacy Bitcoin is being readopted, which will cause a stampede effect and thus a reversion to the 8 or perhaps 10 multiplier. Again 8 would place it near to my $78k expectation.
Also the above linked Medium blog gives a very useful metric for timing the ATH, when the 111 DMA crossed over 2 multiplied by the 350 DMA. We should remember to watch for that. So estimating now roughly when the 3.5 month average price is higher than somewhere above $20+k. So if we take my 3 consecutive month price estimates $13k, $21k, and $32k and presuming some acceleration along the way to average is weighted more towards the lower prices. Also those are peak prices, with dips in between. And the 350 DMA is likely to be higher than $10k. So a quick moon shot to $50+k in April after a dip from $32k in March, is within the realm of mathematical possibility.
$32k is the minimum for the ATH before May 2020, presuming my thesis is correct that the price will be pumped in advance of a posited SegWit attack at the halving.
Interestingly the 350 DMA should be ~8+k by early January, so a 1.6 multiplier would be $13k. By February should be $8.5+k thus 2 to 2.4 multiplier provides my $21k target (remember the tweening). By March $9 $10k, so the 3 4 multiplier will provide my $32k target.
Strangely the fractal pattern at the current juncture for LTC/USD could be correlated to either early to mid Feb 2019 or Jan 10 2019. It appears LTC may be accelerating in time (but not in proportional price) compared to the prior fractal pattern earlier this year. So perhaps LTC will not decline below $60 again in 2019.
Whereas, BTC appears to not be accelerating in time but is accelerating in proportional price.
By proportional price, I mean compare the price rises from the prior $22 and $3102 bottoms as the difference in price from the bottom divided by the price drop from the cliff edge at $56 and $6550.
The calculation shows that LTC is 93% and BTC is 260% (2.6X) of the proportional price rises thus far compared to the prior fractal.
Thus I compute projected prices for LTC of $82, $116, and $158. And for BTC three consecutive monthly highs of $13k, $21k, and $32k.
But those prices do not have to occur at the same time, especially not the $82.
It seems the only way to fulfill the 0.01 LTC/BTC target is for LTC/USD to hit $82 while BTC/USD drops to $8200. Then the $116 can occur with a rocket shot in BTC to $13k. I was expecting that rocket shot at start of February, but everything may be accelerating in time.
Recently @infofront cited a Twitter post that said the LTC miners are preparing to disconnect their machines and pumping the LTC price so they can get out and liquidate their mining equipment (and LTC) at the best prices. Apparently they expect BTC dominance to return soon and they want to cash out.
BTC/USD may decline to $8200 before end of November with LTC rising to $82 as the very short altcoin season bleeds BTC for a month only. Then BTC slowly rising to $9600 before end of 2019. Then a rocket shot to $13k on Armstrongs ECM turn date in the start of January. With LTC rising to $116. Then $158 and $21k in February. In March BTC hits $32k and LTC and all altcoins are declining. In April BTC goes supernova to $50+k. My target for a spike high was $78k.
Lets revisit what may end up being a very, very important blog, perhaps even more important than Plan Bs stock-to-flows model:
https://medium.com/@positivecrypto/the-golden-ratio-multiplier-c2567401e12a
Focus on this chart:
Interestingly at the recent $13.8k high, the ratio to the 350 DMA was 2.4. That places it between the red and purple lines. Which thus corresponds to a tweening between the peaks in Q3 2012 and Q3 2013. Whereas the corresponding peak in 2015 commensurately before the halving was only up to the green line, so current fractal pattern is not corresponding to the 5 multiplier. And if we do get a rocket shot into the May (actually late April) 2020 halving, then the chart is going to look very fractally similar to the 2013 rocket shot.
So this means (as I had posited previously) that the multiplier for the coming peak in late April 2020 should be between 8 and 13. The 350 DMA is currently $7k and will rise to greater than $10k. Even if the multiplier does decline to 3 as that blog posits, that is still going to be in excess of $30k for the peak. So perhaps my $32k will be the peak and perhaps the rocket shot to $13k will not begin until February 2020.
However, I assert that the legacy Bitcoin is being readopted, which will cause a stampede effect and thus a reversion to the 8 or perhaps 10 multiplier. Again 8 would place it near to my $78k expectation.
Also the above linked Medium blog gives a very useful metric for timing the ATH, when the 111 DMA crossed over 2 multiplied by the 350 DMA. We should remember to watch for that. So estimating now roughly when the 3.5 month average price is higher than somewhere above $20+k. So if we take my 3 consecutive month price estimates $13k, $21k, and $32k and presuming some acceleration along the way to average is weighted more towards the lower prices. Also those are peak prices, with dips in between. And the 350 DMA is likely to be higher than $10k. So a quick moon shot to $50+k in April after a dip from $32k in March, is within the realm of mathematical possibility.
$32k is the minimum for the ATH before May 2020, presuming my thesis is correct that the price will be pumped in advance of a posited SegWit attack at the halving.
Interestingly the 350 DMA should be ~8+k by early January, so a 1.6 multiplier would be $13k. By February should be $8.5+k thus 2 to 2.4 multiplier provides my $21k target (remember the tweening). By March $9 $10k, so the 3 4 multiplier will provide my $32k target.
My current scenario after studying carefully the fractal pattern correlation. The current U-shaped correction appears to be roughly 71% of the duration of the prior one earlier this year.
BTC should bottom on this current retracement below $8500 by Nov. 24. The ideal target is $8200. LTC will retrace to somewhere between $57 and $60.
On ~Nov 24, a spike up for LTC and BTC to ~$70 and ~$8700. Then a decline over next several days to $60 $64 and $8 $8.4k. Then another spike up on ~Dec. 5 to ~$75 and $9.7k. Then a decline over next couple of days to ~$65 and ~$8.5k. Then by ~Dec. 13 a spike up for LTC coupled with a slow rise for BTC to ~$80 and $8.7k. Then slow rise by ~Dec. 22 to ~$83 and $8.9k.
Thus I see LTC/BTC reaching only a maximum of 0.0093, although perhaps 0.0098 is possible on some intraday spike divergence for LTC and BTC. I would probably sell LTC at $80 and thus 0.0092 is likely the best I could achieve. Given an entry at 0.0069, that would be a 33% gain in BTC, if repurchasing BTC immediately after selling LTC. Those who entered at 0.006 might get a 50% gain in BTC if they time it perfectly.
Another strategy might be to sell maybe half at $75 and then if LTC drops to $65 repurchase for a 15% gain, else (if LTC does not drop) purchase BTC for ~$8.5k (because it seems BTC must drop otherwise it cant rise to $8.7k), so that is still a 27% gain in BTC is purchased LTC when LTC/BTC was 0.0069.
Frankly only a 33% potential gain (relative to BTC) is not all that incredibly enticing given the risk of the volatility of LTC. Timing may be end up elusive.
GRS-GRS-GRS-GRS-GRS-GRS-GRS-GRS-GRS-GRS-GRS-GRS-GRS-GRS-GRS
I did the same calculations for GRS and its about 3X leveraged in price compared to the prior fractal earlier this year. On ~Nov 24, GRS should rise to ~0.27 which if BTC is $8700, then GRS/BTC will be 0.000031. Then by ~Dec. 13 a spike up ~$0.48, and thus GRS/BTC 0.000055. So I think GRS/BTC has better leverage and can double your BTC, but you must have your sell limit orders waiting because the spikes can be completed in a couple of hours sometimes. A strategy would be to sell maybe half at $0.27 and attempt to reload at $0.23 or purchase BTC at $8700.
In this scenario, the rocket shot is timed perfectly with Armstrongs monumental ECM turn date, so ~Jan 1, 2020, a rocket shot to ~$116 and ~$12.5k. That will be the last chance to trade LTC for BTC. BTC may have an intraday (or next day) spike low of $11k. So if you sold at say $110 and repurchased $11.5k, that would be 0.096, thus increasing potential BTC gains to 40% (if purchased when LTC/BTC is 0.0069) or 65% if entered when LTC/BTC was 0.006. But thats going to be some chaotic timing. Hope the exchanges dont get slammed.
In this scenario, during the rest of January LTC will decline to ~$86 and BTC will oscillate but reach a peak of $13k. I wonder if we will get another flash crash in late January to $10k this time, mimicking the flash crash in April 2019.
In this timing scenario, before Feb 12 (2020), BTC will spike up again to $21k. Within a week a decline to perhaps ~$17.3k. Then another rocket shot to ~$32k by ~March 2.
The market would be somewhat confused at this point because the ATH would have been significantly exceeded well before the halving. Thus I would expect some sort of deeper and slightly longer correction. Maybe back to $21k again to throw many off the train who are looking to repurchase below the 2017 $20k ATH before the halving currently targeted for May 14:
https://www.bitcoinblockhalf.com/
That and including the uncertainty about whether the price will indeed go higher than ~$32k before any SegWit attack is why I will probably take all the cash I am going to need at $32k, then perhaps repurchase half of what I sold if the price drops to say $21k before the halving. Also I will be keeping my eye on the 111 DMA vs. twice the 350 DMA as mentioned in my prior email. Such an extended decline might be necessary to keep that 111 DMA from prematurely crossing down under twice the 350 DMA.
So then in April suddenly a moonshot to $50+k. Again my target is $78k but I will reaccess at that time after looking at all factors including where is the 350 DMA at that juncture.