@exstasie: Thanks for the useful insight into trading. I studied more about it. I checked the links you shared related to using Volume for improving the trading, there is a section in that article which explains how to use Volume to identify bullish signs.
Specifically:
"Volume can be very useful in identifying bullish signs. For example, imagine volume increases on a price decline and then the price moves higher, followed by a move back lower. If the price on the move back lower stays higher than the previous low and volume is diminished on the second decline, then this is usually interpreted as a bullish sign."
So, I applied this knowledge to the XRP/USDT chart on Poloniex today and I think I understood it correct. Could you please check the screenshot I made and tell me if I understood it correct?
1. Price was declining and volume was increasing
2. Price increased and volume decreased
3. Price decreased again but now the new price low was greater than previous price low (with a reduced volume)
So, based on the idea mentioned in article, this would indicate a bullish sign?
I do see in the chart that price started moving up sharply shortly after this.
https://images2.imgbox.com/9e/a0/e0Ff208x_o.png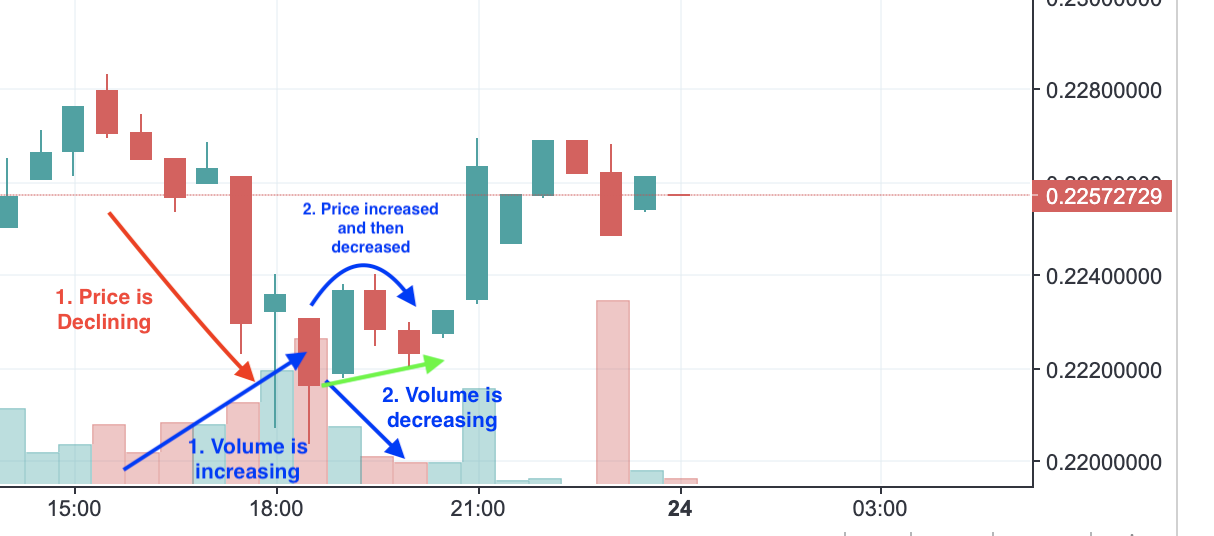