Hello friends. This analysis is for me and as you know, no one's science is perfect.
So let's help each other with our opinions.
Well, let's go to the analysis :
:
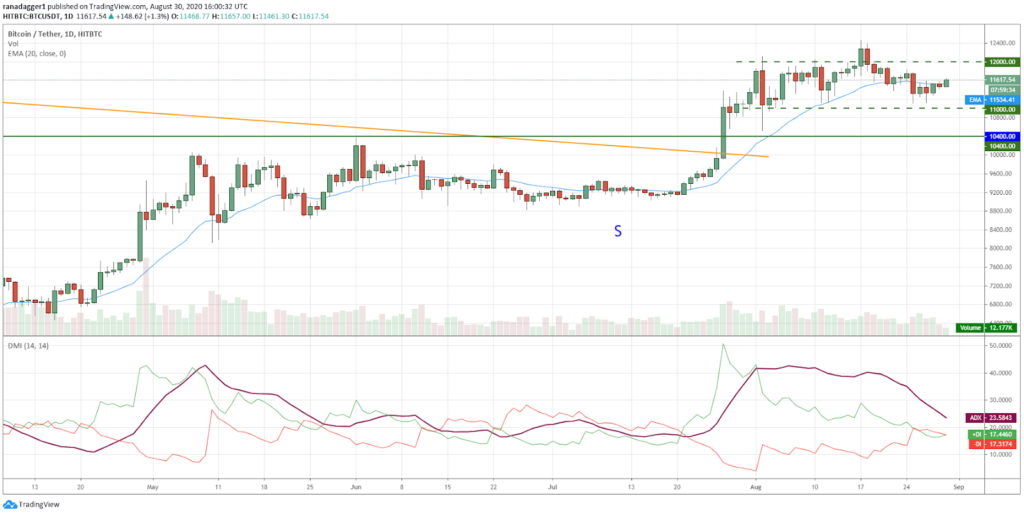
The Directional Mean Index (ADX), which is a component of the Directional Movement Index (DMI), has fallen below the 24 level and the slope of the 20-day moving average (EMA 20 - blue line in the picture) is horizontal.
These factors indicate a significant weakening of the bitcoin price trend.
http://s10.picofile.com/file/8407461842/BTCUSDT831_1024x515.png
The price is currently between the 11,000$ low and the 12,000$ high. These fluctuations cause the + DI or positive directional indicator (green line) to approach -DI or the negative directional indicator (red line in the image above).
After sellers failed to lower the price below 11,000$ on August 25-27, buyers in the current situation will try to push it above the resistance level of
12,000$ to 12,460$. In this case, there is a possibility of starting a new wave of the next uptrend.
However, if the price moves down from this resistance area, it will probably spend more time in this area.
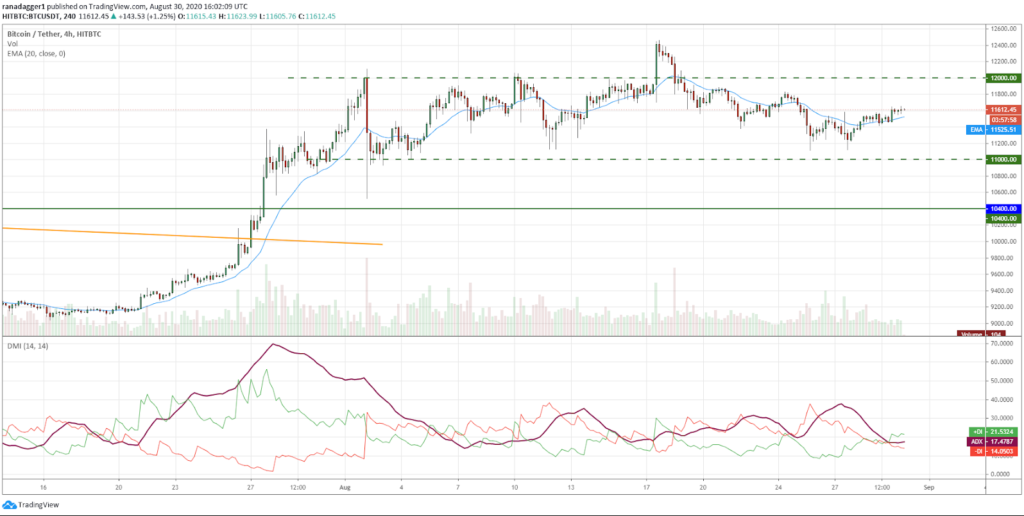
http://s11.picofile.com/file/8407462226/BTCUSDT4h831_1024x516.png
The fluctuation of DI + and -DI near each other and the placement of the directional average index (ADX) below the level of 18, indicates the balance between supply and demand. The small positive point here is the strong support of buyers in the support area of 11,000$ to 11,200$. In the current situation, they will try to push the price up to 12,000$.
However, as long as the acceleration of the price movement does not increase, the probability of breaking the resistance zone in the short term will be low. So limited price movements will continue for a few more days.
Thank you for reading this analysis.
Good luck
So let's help each other with our opinions.
Well, let's go to the analysis
:The Directional Mean Index (ADX), which is a component of the Directional Movement Index (DMI), has fallen below the 24 level and the slope of the 20-day moving average (EMA 20 - blue line in the picture) is horizontal.
These factors indicate a significant weakening of the bitcoin price trend.
http://s10.picofile.com/file/8407461842/BTCUSDT831_1024x515.png
The price is currently between the 11,000$ low and the 12,000$ high. These fluctuations cause the + DI or positive directional indicator (green line) to approach -DI or the negative directional indicator (red line in the image above).
After sellers failed to lower the price below 11,000$ on August 25-27, buyers in the current situation will try to push it above the resistance level of
12,000$ to 12,460$. In this case, there is a possibility of starting a new wave of the next uptrend.
However, if the price moves down from this resistance area, it will probably spend more time in this area.
http://s11.picofile.com/file/8407462226/BTCUSDT4h831_1024x516.png
The fluctuation of DI + and -DI near each other and the placement of the directional average index (ADX) below the level of 18, indicates the balance between supply and demand. The small positive point here is the strong support of buyers in the support area of 11,000$ to 11,200$. In the current situation, they will try to push the price up to 12,000$.
However, as long as the acceleration of the price movement does not increase, the probability of breaking the resistance zone in the short term will be low. So limited price movements will continue for a few more days.
Thank you for reading this analysis.
Good luck