Search content
Sort by
Showing 2 of 2 results by ehsan8787
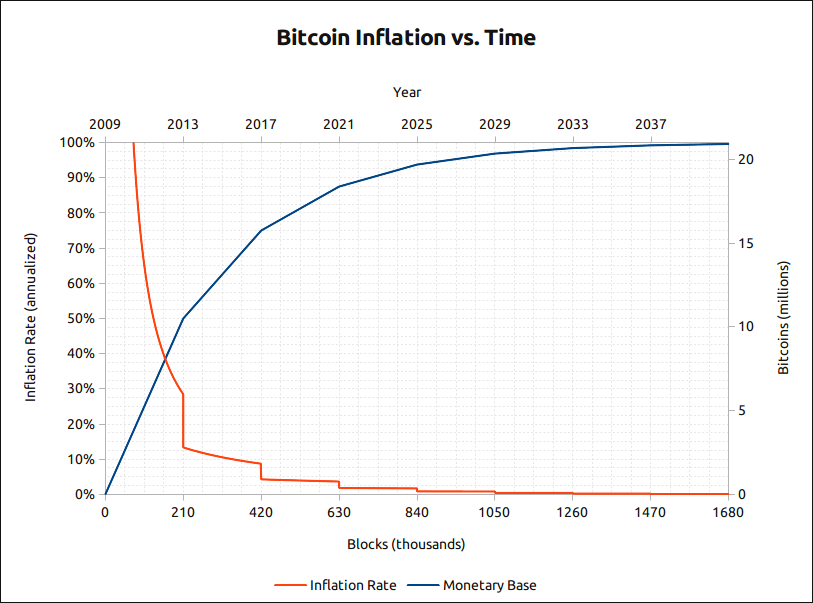
A clarifying note: These charts show the monetary (supply) inflation of Bitcoin. They bear no relation to price inflation, which is an entirely distinct phenomenon. When Austrian economists say "inflation," they're typically referring to monetary inflation, whereas Keynesian economists are typically referring to price inflation.
Also, please note that the top axis ("Year") on these charts is approximate, based on the scheduled block generation rate of one block per 10 minutes. The actual block generation rate has averaged a bit faster than this, due to the perpetually increasing hash rate, so we're already a little bit further progressed than the labels along the top axis would suggest. This doesn't mean there will be any more than 21M bitcoins; it only means that we'll reach the end of supply generation a little bit sooner than we would have if the hash rate had always held constant.
Permission given to use and reproduce freely.
great👍👍Also, please note that the top axis ("Year") on these charts is approximate, based on the scheduled block generation rate of one block per 10 minutes. The actual block generation rate has averaged a bit faster than this, due to the perpetually increasing hash rate, so we're already a little bit further progressed than the labels along the top axis would suggest. This doesn't mean there will be any more than 21M bitcoins; it only means that we'll reach the end of supply generation a little bit sooner than we would have if the hash rate had always held constant.
http://www.mattwhitlock.com/Bitcoin%20Inflation.png
Bitcoin Inflation 4x3.pdf (8"×6") | Bitcoin Inflation.pdf (8½"×11")
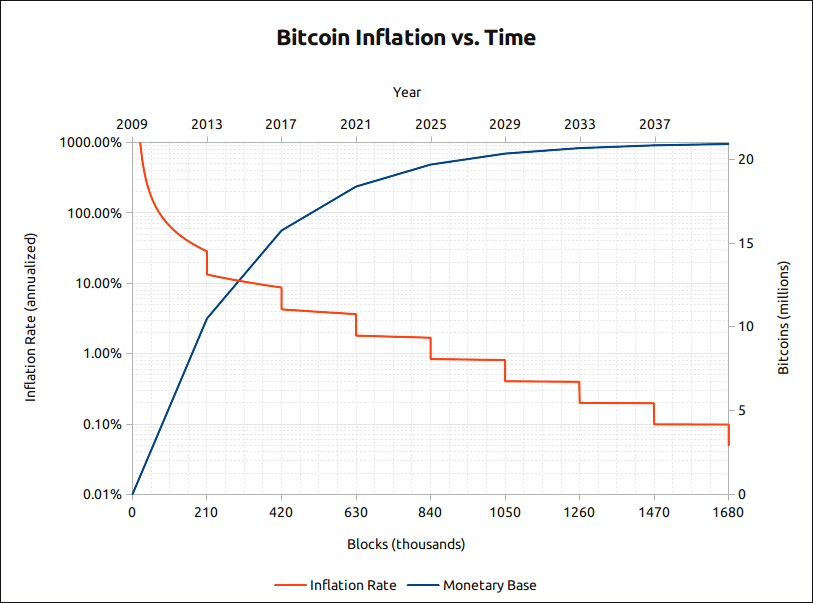
http://www.mattwhitlock.com/Bitcoin%20Inflation%20logarithmic.png
Bitcoin Inflation logarithmic.pdf (8"×6")
Bitcoin Inflation 4x3.pdf (8"×6") | Bitcoin Inflation.pdf (8½"×11")
http://www.mattwhitlock.com/Bitcoin%20Inflation%20logarithmic.png
Bitcoin Inflation logarithmic.pdf (8"×6")
Permission given to use and reproduce freely.
While I despise them, I see the genius of the Federal Reserve system.
There's genius in stealing?
