Note that the percent changes (not increases) from year to year were
 2011 -> 2012  300%
 2012 -> 2013 3024%
 2013 -> 2015  314%
Neither constant, not uniformly increasing.
What will be the percent change 2014 -> 2015?
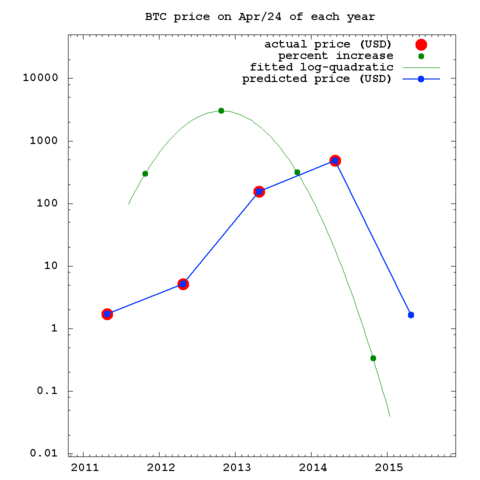
The simplest formula that will fit the three data points above is a parabola. Working in log scale, this is what I get:
http://www.ic.unicamp.br/~stolfi/temp/2014-04-24-april-prices-extrap.pngHorrible chart, because you ignored valid data. You can't just ignore previous years.