Search content
Sort by
Showing 20 of 27 results by CryptoSpaceGroup
⭐ Merited by cexylikepie (1)
Here we go:
In the world of day trading, your ability to read charts is one of your greatest survival tools. Being able to understand the significance of price action can help you better understand how price will move in the future. To put it simply, historical price action helps us predict future price action. Of course, its important to note that we can never predict price action with 100% certainty. For that reason, we can use a combination of pattern recognition and risk management to place trades with higher probabilities of profitability.
Trend Lines
Trend lines can be used to analyze the trend for a specific time frame. If price is setting higher lows and higher highs, it is experiencing an uptrend. If price is setting lower lows and lower highs, it is experiencing a downtrend.
Its very important to focus on trend lines that are relevant to your timeframe. For example, if you plan on holding for a week, you want to focus on a shorter term time frame (such as an 4h/6h chart). These trend lines can be used to gauge momentum. They can also be used as levels of support and resistance.
http://tradersforpeople.ml/Trendlines.jpg
Support/Resistance
Support and resistance levels are very insightful risk analysis tools. A support level is a price level at which buyers historically overpowered sellers, and a resistance level is a price level at which sellers historically overpowered sellers. You can find support/resistance levels at static price points or by using trend lines.
http://tradersforpeople.ml/supportandresistance.jpg
Moving Averages
Moving averages are technical indicators used to smooth out price action. A moving average is simply an average of closing prices for a certain period. For example, a 200-day simple moving average on a daily chart would be the average of the past 200 closing prices. These moving averages can be used on charts from any timeframe (i.e. intraday, hourly, daily, weekly, etc). You may also use exponential moving averages (EMAs), which assign more weight to recent price action.
There is no perfect set of moving averages. Your goal is to use moving averages that help you make smarter trading decisions. You also want to be consistent with your analysis. For example, if you always use the 50-EMA on an hourly chart, stick with that approach. Moving averages are used to help you make smarter trading decisions NOT to validate your ideas.
http://tradersforpeople.ml/movingaverages.jpg
Gearing/Perking (ABCD chart pattern)
Gearing and perking behavior can allude to a change in momentum.
http://tradersforpeople.ml/abcd.jpg
The price runs up, reaches a level of equilibrium, comes back down and reaches another level of equilibrium. After that happens, the price starts to perk a bit off it's (current time frame) low, which may foreshadow an upcoming breakout. You can also use the previous equilibrium level (support) as a set risk level. Here's how this looks when using the ABCD pattern.
http://tradersforpeople.ml/gearing.jpg
ABCD pattern is one of the best chart patterns for new traders to focus on.
Buy Dips/Long Trades
Buying dips is a way of minimizing risk when you are anticipating a certain move. Essentially, you are buying into weakness and selling into strength, meaning you will get better fills when anticipating a move.
http://tradersforpeople.ml/buyingdips.jpg
For example, lets say you are expecting price to breakout. You have the option to buy the breakout once it is confirmed OR you can start building a position in anticipation of the breakout. The latter option lowers your risk and increases your upside potential.
Accounting for risk is an important part of this anticipation process. You should always know how much you expect to gain if the trade goes in your favor vs. how much you could lose if the trade goes against you.
Double and Triple Bottoms/Long Trades
While price can theoretically drop forever, it will generally find short-term bottoms along its descent. These bottoms can be used to predict a short-term trend reversal, also known as a bounce.
http://tradersforpeople.ml/doublebottoms.jpg
When price double or triple bottoms, it sets a support level and re-tests that level once or twice. If the support level holds, we can use it to gauge risk for a trade. At this point, wed be interested in seeing the price break a downtrend line or break above current time frame resistance for a nice short-term reversal play.
I think for the first part(for beginning) it's enough.
Later (i will try ASAP), i'll make a second part.
I think the trading community here welcomes all new initiatives from groups like yours, especially if you're not seeking profits from payment - sharing advice and strategies will never be frowned upon. Like you, I also think all the paid groups are rubbish at worst, unhelpful at best. Even the highest paid signals barely give you enough information about the decisions behind the trade - and no, a chart and a few lines of FA/TA is hardly the best information to justify most signals.
Full transparency would be appreciated. Every single entry and exit point, with full disclosure of order size against bankroll. Also shockingly missing from all these paid signal groups.
Full transparency would be appreciated. Every single entry and exit point, with full disclosure of order size against bankroll. Also shockingly missing from all these paid signal groups.
Thanks !
After some basic info/posts, we will try to do exactly what you say about full transparency and "Every single entry and exit point, with full disclosure of order size against bankroll". For every our trades that we will release here.
I decides to learning by doing, meaning practice with real money direct into real market. Try to my skill and believe in me is what I try to be done. I see you're good but I'm afraid I have to say not follow you, it will break what I built. Good luck with your program and I'll see you soon on the top.
Thanks !
That's good, that you learning/developing in trading by yourself ! Wish you profits and consistency, it's a hard way at all.
http://tradersforpeople.ml/successfultraders.jpg
Here we go:
In the world of day trading, your ability to read charts is one of your greatest survival tools. Being able to understand the significance of price action can help you better understand how price will move in the future. To put it simply, historical price action helps us predict future price action. Of course, its important to note that we can never predict price action with 100% certainty. For that reason, we can use a combination of pattern recognition and risk management to place trades with higher probabilities of profitability.
Trend Lines
Trend lines can be used to analyze the trend for a specific time frame. If price is setting higher lows and higher highs, it is experiencing an uptrend. If price is setting lower lows and lower highs, it is experiencing a downtrend.
Its very important to focus on trend lines that are relevant to your timeframe. For example, if you plan on holding for a week, you want to focus on a shorter term time frame (such as an 4h/6h chart). These trend lines can be used to gauge momentum. They can also be used as levels of support and resistance.
http://tradersforpeople.ml/Trendlines.jpg
Support/Resistance
Support and resistance levels are very insightful risk analysis tools. A support level is a price level at which buyers historically overpowered sellers, and a resistance level is a price level at which sellers historically overpowered sellers. You can find support/resistance levels at static price points or by using trend lines.
http://tradersforpeople.ml/supportandresistance.jpg
Moving Averages
Moving averages are technical indicators used to smooth out price action. A moving average is simply an average of closing prices for a certain period. For example, a 200-day simple moving average on a daily chart would be the average of the past 200 closing prices. These moving averages can be used on charts from any timeframe (i.e. intraday, hourly, daily, weekly, etc). You may also use exponential moving averages (EMAs), which assign more weight to recent price action.
There is no perfect set of moving averages. Your goal is to use moving averages that help you make smarter trading decisions. You also want to be consistent with your analysis. For example, if you always use the 50-EMA on an hourly chart, stick with that approach. Moving averages are used to help you make smarter trading decisions NOT to validate your ideas.
http://tradersforpeople.ml/movingaverages.jpg
Gearing/Perking (ABCD chart pattern)
Gearing and perking behavior can allude to a change in momentum.
http://tradersforpeople.ml/abcd.jpg
The price runs up, reaches a level of equilibrium, comes back down and reaches another level of equilibrium. After that happens, the price starts to perk a bit off it's (current time frame) low, which may foreshadow an upcoming breakout. You can also use the previous equilibrium level (support) as a set risk level. Here's how this looks when using the ABCD pattern.
http://tradersforpeople.ml/gearing.jpg
ABCD pattern is one of the best chart patterns for new traders to focus on.
Buy Dips/Long Trades
Buying dips is a way of minimizing risk when you are anticipating a certain move. Essentially, you are buying into weakness and selling into strength, meaning you will get better fills when anticipating a move.
http://tradersforpeople.ml/buyingdips.jpg
For example, lets say you are expecting price to breakout. You have the option to buy the breakout once it is confirmed OR you can start building a position in anticipation of the breakout. The latter option lowers your risk and increases your upside potential.
Accounting for risk is an important part of this anticipation process. You should always know how much you expect to gain if the trade goes in your favor vs. how much you could lose if the trade goes against you.
Double and Triple Bottoms/Long Trades
While price can theoretically drop forever, it will generally find short-term bottoms along its descent. These bottoms can be used to predict a short-term trend reversal, also known as a bounce.
http://tradersforpeople.ml/doublebottoms.jpg
When price double or triple bottoms, it sets a support level and re-tests that level once or twice. If the support level holds, we can use it to gauge risk for a trade. At this point, wed be interested in seeing the price break a downtrend line or break above current time frame resistance for a nice short-term reversal play.
I think for the first part(for beginning) it's enough.
Later (i will try ASAP), i'll make a second part.
In the world of day trading, your ability to read charts is one of your greatest survival tools. Being able to understand the significance of price action can help you better understand how price will move in the future. To put it simply, historical price action helps us predict future price action. Of course, its important to note that we can never predict price action with 100% certainty. For that reason, we can use a combination of pattern recognition and risk management to place trades with higher probabilities of profitability.
Trend Lines
Trend lines can be used to analyze the trend for a specific time frame. If price is setting higher lows and higher highs, it is experiencing an uptrend. If price is setting lower lows and lower highs, it is experiencing a downtrend.
Its very important to focus on trend lines that are relevant to your timeframe. For example, if you plan on holding for a week, you want to focus on a shorter term time frame (such as an 4h/6h chart). These trend lines can be used to gauge momentum. They can also be used as levels of support and resistance.
http://tradersforpeople.ml/Trendlines.jpg
Support/Resistance
Support and resistance levels are very insightful risk analysis tools. A support level is a price level at which buyers historically overpowered sellers, and a resistance level is a price level at which sellers historically overpowered sellers. You can find support/resistance levels at static price points or by using trend lines.
http://tradersforpeople.ml/supportandresistance.jpg
Moving Averages
Moving averages are technical indicators used to smooth out price action. A moving average is simply an average of closing prices for a certain period. For example, a 200-day simple moving average on a daily chart would be the average of the past 200 closing prices. These moving averages can be used on charts from any timeframe (i.e. intraday, hourly, daily, weekly, etc). You may also use exponential moving averages (EMAs), which assign more weight to recent price action.
There is no perfect set of moving averages. Your goal is to use moving averages that help you make smarter trading decisions. You also want to be consistent with your analysis. For example, if you always use the 50-EMA on an hourly chart, stick with that approach. Moving averages are used to help you make smarter trading decisions NOT to validate your ideas.
http://tradersforpeople.ml/movingaverages.jpg
Gearing/Perking (ABCD chart pattern)
Gearing and perking behavior can allude to a change in momentum.
http://tradersforpeople.ml/abcd.jpg
The price runs up, reaches a level of equilibrium, comes back down and reaches another level of equilibrium. After that happens, the price starts to perk a bit off it's (current time frame) low, which may foreshadow an upcoming breakout. You can also use the previous equilibrium level (support) as a set risk level. Here's how this looks when using the ABCD pattern.
http://tradersforpeople.ml/gearing.jpg
ABCD pattern is one of the best chart patterns for new traders to focus on.
Buy Dips/Long Trades
Buying dips is a way of minimizing risk when you are anticipating a certain move. Essentially, you are buying into weakness and selling into strength, meaning you will get better fills when anticipating a move.
http://tradersforpeople.ml/buyingdips.jpg
For example, lets say you are expecting price to breakout. You have the option to buy the breakout once it is confirmed OR you can start building a position in anticipation of the breakout. The latter option lowers your risk and increases your upside potential.
Accounting for risk is an important part of this anticipation process. You should always know how much you expect to gain if the trade goes in your favor vs. how much you could lose if the trade goes against you.
Double and Triple Bottoms/Long Trades
While price can theoretically drop forever, it will generally find short-term bottoms along its descent. These bottoms can be used to predict a short-term trend reversal, also known as a bounce.
http://tradersforpeople.ml/doublebottoms.jpg
When price double or triple bottoms, it sets a support level and re-tests that level once or twice. If the support level holds, we can use it to gauge risk for a trade. At this point, wed be interested in seeing the price break a downtrend line or break above current time frame resistance for a nice short-term reversal play.
I think for the first part(for beginning) it's enough.
Later (i will try ASAP), i'll make a second part.
Its great to know you're offering trading tips and tutorials for free. I myself don't know how to read charts and I trade by instincts and trading volume. To be a professional trader needs great knowledge on alts and cryptocurrency movements with continues research. I'll follow your post. Thank you.
I have trouble reading the charts in the trade, and I doubt if this works well or just guesses like playing dice.
there are many terms in trading that I do not understand like bulltrap and others. I feel this is too complicated my trading is only using instinct and experience I think it is quite helpful.
there are many terms in trading that I do not understand like bulltrap and others. I feel this is too complicated my trading is only using instinct and experience I think it is quite helpful.
Thanks guys !
I'll provide some basic content for you and others who need it.
In my opinion, if you have enough of the knowledge and awareness regarding the things and that you think that you can do well in trading, then you need to do it for yourself other than that of doing it for others. This wont help you in making of enough of the earning and that you will only be putting so many efforts to earn a huge money and that too for someone else. You need to do it for yourself.
Thank you for this !
I did for myself enough, so why not do it for people now

I think the first signal they share and that is free is to encourage people to come on to their group, but I believe the next is not free anymore you need to work on them or pay for them, but if you sense anything weird in between then it better to leave.
I don't want say more/again about "why you doing it for free".
In any case you have your own right/opinion about it, and if you don't like it or as you say "if you sense anything weird in between then it better to leave".
It's ok
Oh, thanks for the quick reply.
Your tactic is interesting to close the position in parts. Greed does not allow me to immediately take this into service. Are there any statistical data confirming the feasibility of this method of trading?
With Pundi-x it turns out interesting. This was a significant drop in prices in a falling volume. Just where you would sell.
Greed is sin
especially in trading !Well, as for us, we don't have statistic for those trades (multi-day pumps), it's not necessary for us for now (we did it for a long time and not only on cryptomarket, so we know that it's work and it's the best way of keeping profit).
You can also see it at that examples in your post, or an any others multi-day pumps, it's always the same.
If you need an examples, i can make a bunch of charts.
Thanks everyone who reply here ! It's giving some motivation, that people are care about it.
To much work not enough time, as always
I'll answer in a order, then will post some basic useful info.
To much work not enough time, as always
I'll answer in a order, then will post some basic useful info.
This sounds like a nice initiative. I really don't like how so much people in crypto just pay for trading signals and just follow them blindly. If one group is over they have to look for another because, they still have no clue how to trade by themselves. Sharing those technical analysis for free is a great way to encourage people to learn more about crypto market.
BTW why two threads?
BTW why two threads?
Thanks !
THAT IS TRUE !!
About threads - wasn't sure which of would be right thread. So, have to decide, which of them make one/main.
Discussion is here - https://bitcointalk.org/index.php?topic=3758861.0
Any reason why you have two threads going on?
wasn't sure which of this would be right
Discussion is here - https://bitcointalk.org/index.php?topic=3758861.0
If you are trading in the mid term, I have a question.
There are excellent powerful movements for several weeks. Eg
https://coinmarketcap.com/currencies/oyster/
PRL November 2017-January 2018,
https://coinmarketcap.com/currencies/deeponion/
onion December 2017-January 2018. The distribution is clearly visible in both cases. Post factum. In one of these examples I was unable to determine the time out and still keep it)
How do you determine the distribution after a multi-day pump? NPXS realtime analysis example: https://coinmarketcap.com/currencies/pundi-x/
Thanx
Thanks !
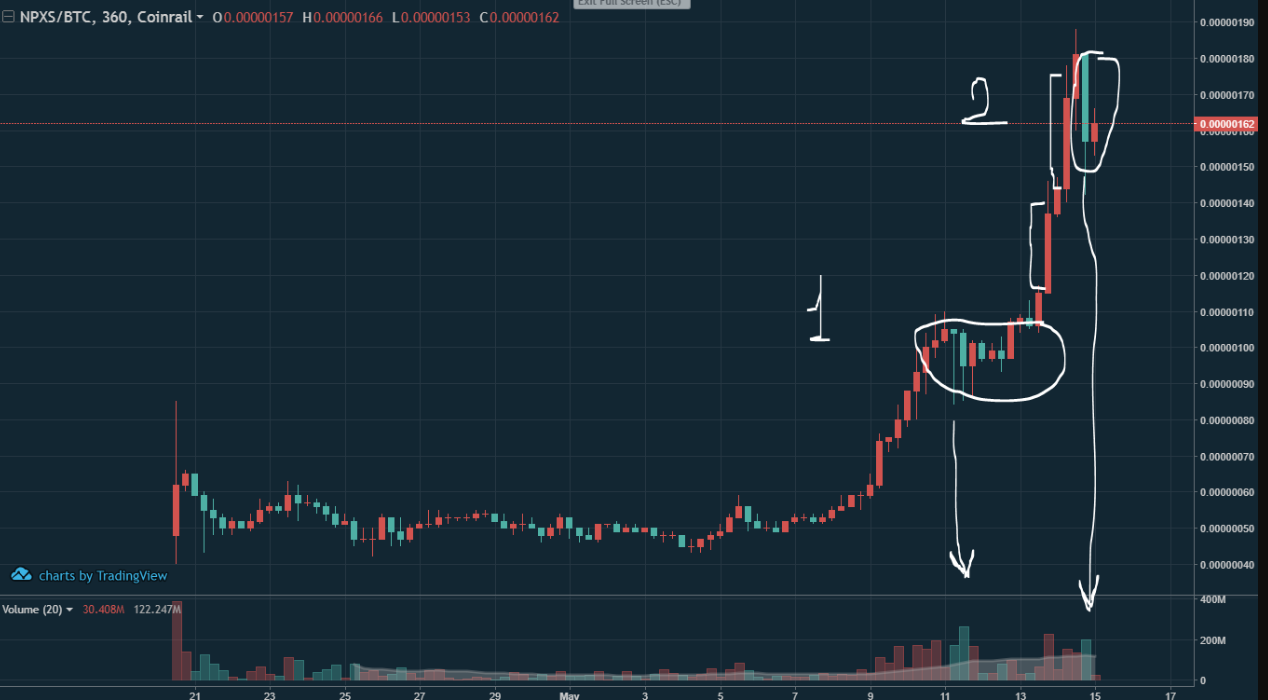
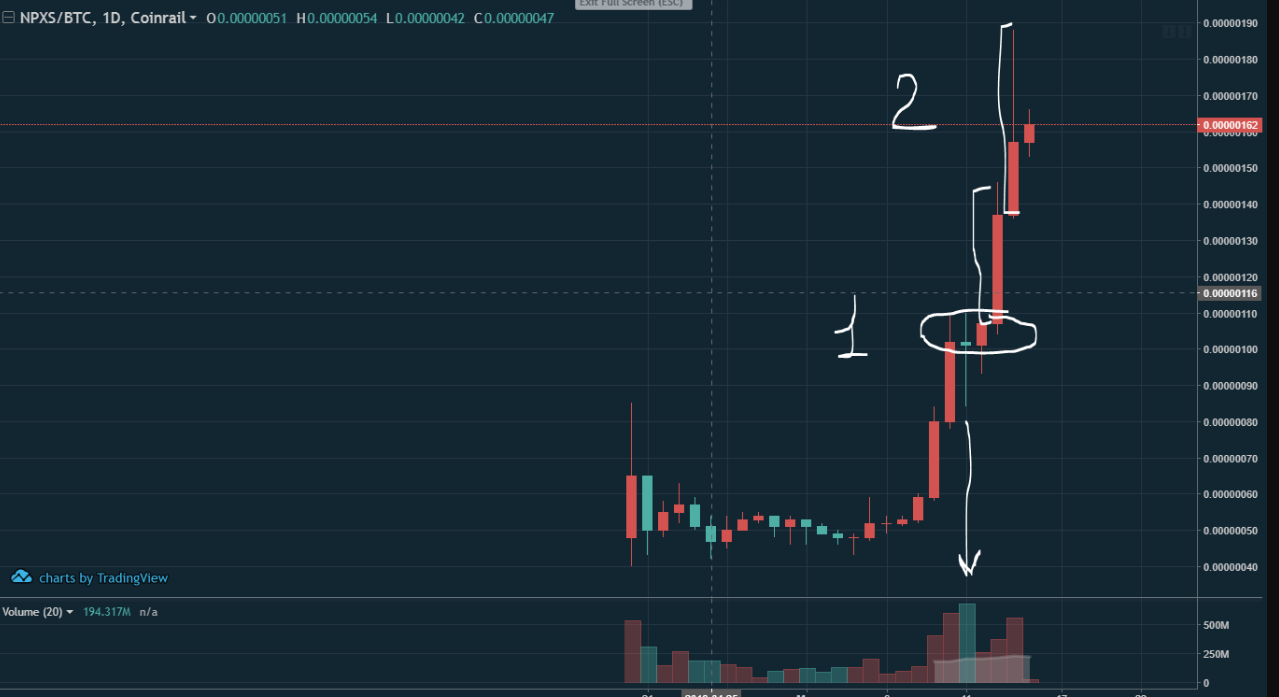
One of the key to keep profit of midterm multi-day pump it's - sell partially (take profit partially) - because actually you can't know when pump is going dump
How can you know when you should sell your first part:
- After the first wave of pump, price usually making first stop, something like consolidation, around some "beautiful" prices like 0.00010, 0.000050, 0.0020, 0.000250 etc, or some strong levels. At this first price stop, you should sell part of your size (at least 40%).
- Then going second wave (in 60-70% it's a last wave), if there are huge 90 degrees candleson daily/less time frame chart w/ growing volume - it's the call to sell rest of your position (at least 80% of your amount you should sell). Also, there is a big dumping volume w/ a big dump candel that tell's that pump might be end here.
(if you see the exponential speeding chart it's always a call to get ready for dump )
- But there's a chance ( smole chance, but still exist), that pump not over yet,and for that case you have that 20% of your position, which can make you some extra profit or in any case you'll sell with profit.
You should keep on eye on the chart. Manage your position.
(That what we doing w/ multi-day pumps)
About NPXS:
If we was in, on this levels we'd sell our 2nd part (at least 80% of full size)
Chart 1:
https://i.gyazo.com/21ecb2d82473d841696b2c7ae4244ac6.png
Chart 2:
https://i.gyazo.com/62cb989df6e8e0f73393d0f29ddc3e00.png
Explain why you are sharing signals if you are good at earning on them? What is the point to share the profitable signals for free?
Thanks !
I like your question
Well, some explaining in the first post some of - in the answer above
Now please, explain, why we should share the profitable "signals" (again:) not for free? if we making money, why we should charge $$ for share it to others?
There is nothing TOPsecret here. Our point is simple: everyone can make money on cryptotrading (at least on this stage of cryptomarkets developing, comparing with developt stages of financial markets ) and we just want to help people w/ this. Because, when you follow by paid "signals"(where 80% or more are trash) means, that you'll not learn how do trading by yourself, which means you'll never be trader at all, and at the same time you are thinking that you are realy trader
And why it should be wrong/bad/weird/etc to do it for free? I truely dont get it.
Also, point is like a cryptocarrency philosophy, if you know what i mean.
This can be interesting and useful. If you do not start, like many, make money on the signals.
Successes.
Successes.
Thanks !
We are not hunting for tons of people or get some pr for our channel/trades/"signals"(how i like this word lol) or for this thread here, that in future make money on the "signals". NO WAY ! We just want to help people in crypto to understend markert and make money w/ us at the beginnig and then, that they doing it by yourself.
We open for any questions related w/ trading.
still can't get it, what's wrong with pictures here ...
There is nothing wrong with pictures . You just can not post pictures as newbie account . If you want to move this restrict you may want to pay for copper account or just level you account up for free restrict removal ( This is a hard thing to do right now ) So just pay for copper account . Oh, ok, thank you !
BTC review for now briefly
As always, we have two ways of future prices moves
Chart:
http://innovation-device.com/BTC%20May%2014.PNG
Actually, that's our two ways:
Pretty negative signal that Bitcoin could not keep above its month, quarter and half a year average prices, starting new wave of decline exactly from 10k level.
Ahead of another one test of strong support zone in a range 7 000-8 000, which previously held uptrend from July 2017, where can be a huge buyers or a huge sellers which could change technical price view.
In case, if price will hold below this zone, probably we can see an impulse move to 4 500 - 6 000 range. And if price will hold this zone (7 000 - 8 000) above, we can see new buyers w/ 10 000 - 11 500 targets.
Nuls (NULS) "kind of gem"
Have a big potential
Technically looks good
Buy area: 0.000515 - 0.000535
StopLoss: 0.000473
Targets:
1. 0.0005880
2. 0.0006447
3. 0.0006814
4. 0.0007443
=======
Midterm
Strong news in the end of May:
Mobile and PC wallet release
Explorer of the NULS blockchain will be released.
"The Main-Net commences," by end of May.
We are already in.
‼️ IMPORTANT NOTICE ‼️
When coin price made a first/4 TakeProfit, move your StopLoss to your enter price, for avoid huge squeez and save Profit.
Each position that we open is 10% from our deposit.
actual thread - https://bitcointalk.org/index.php?topic=3750796.0